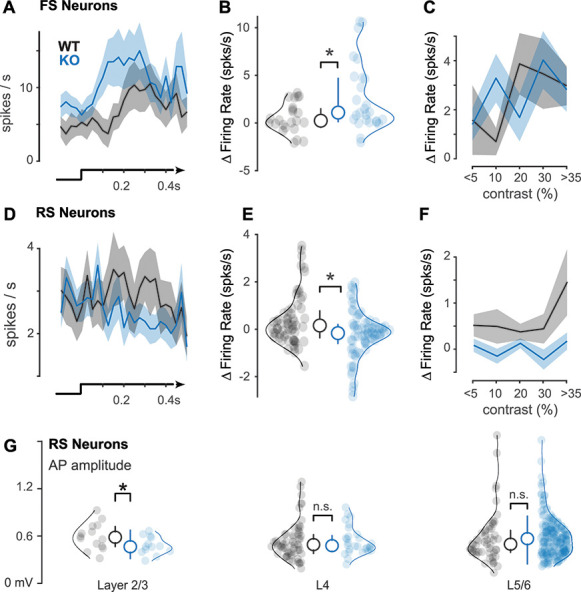
Figure 3 .

Enhanced FS and diminished RS visual responses at discrimination threshold. (A) Peristimulus time histograms of FS neurons during perceptual detection of visual stimuli (bottom) at contrasts defined by the discrimination threshold (~5% for WT mice, ~10% for KO mice, Fig. 1I–K). (B) KO mice have enhanced FS responses to visual stimuli during perceptual detection (WT: 1.58 ± 1.27 spikes/s, n = 20 neurons, mean ± SEM throughout figure; KO: 3.29 ± 1.15, n = 38 neurons, P < 0.05, one-tail Wilcoxon rank sum test; Δfiring rate calculated as difference from prestimulus baseline, see Methods) (C) FS neuron responses as a function of contrast (binned; see Methods). (D) Same as A, for RS neurons. (E) Same as B, for RS neurons. KO mice have diminished RS responses during perceptual detection (WT: 0.52 ± 0.21 spikes/s, n = 49 neurons; KO: −0.15 ± 0.18, n = 103 neurons, P < 0.01, one-tail Wilcoxon rank sum test). (F) Same as C, for RS neurons. (G) Action potential (AP) amplitudes significantly smaller in L2/3 RS neurons in KO mice (0.48 ± 0.03 mV; mean ± SEM, n = 13; 0.59 ± 0.04 mV, n = 14; P < 0.05, one-tail Wilcoxon rank sum test). No differences in L4 (KO: 0.54 ± 0.03; n = 28; WT: 0.54 ± 0.03, n = 59; P = 0.35) or L5/6 (KO: 0.59 ± 0.02; n = 178; WT: 0.58 ± 0.04, n = 53; P = 0.12). Neurons aggregated across awake recordings. Median ± IQR plotted inside distributions throughout figure.
