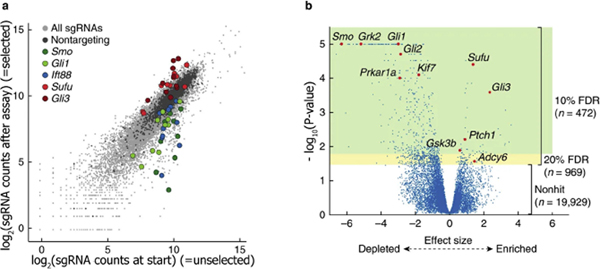
Figure 2. Example of output of a published CRISPR-ko screen.
(a) Scatter plot of a CRISPR screen aiming to systematically identify genes essential for Hedgehog signaling (Breslow et al., 2018). A transcriptional reporter assay allowed selection of cells in which the Hedgehog signaling pathway is active. The plot shows the abundance of sgRNAs (10 per target) at the start of the screen (x-axis; reference population) and after selection for cells with an active Hedgehog signaling pathway (y-axis). sgRNAs targeting selected genes are highlighted, similar colors indicate different sgRNAs targeting the same gene. (b) Volcano plot showing the effect size (x-axis) and P-values (y-axis) as calculated by the Cas9 high throughput likelihood estimator (casTLE) algorithm for this screen (Breslow et al., 2018). Select Hedgehog signaling pathway components are highlighted. Genes with P-value cut-offs corresponding to 10% FDR are highlighted in green, and those corresponding to a 20% FDR are in yellow. FDR, false discovery rate; sgRNA, single guide RNA. Reprinted with permission from Springer-Nature.

