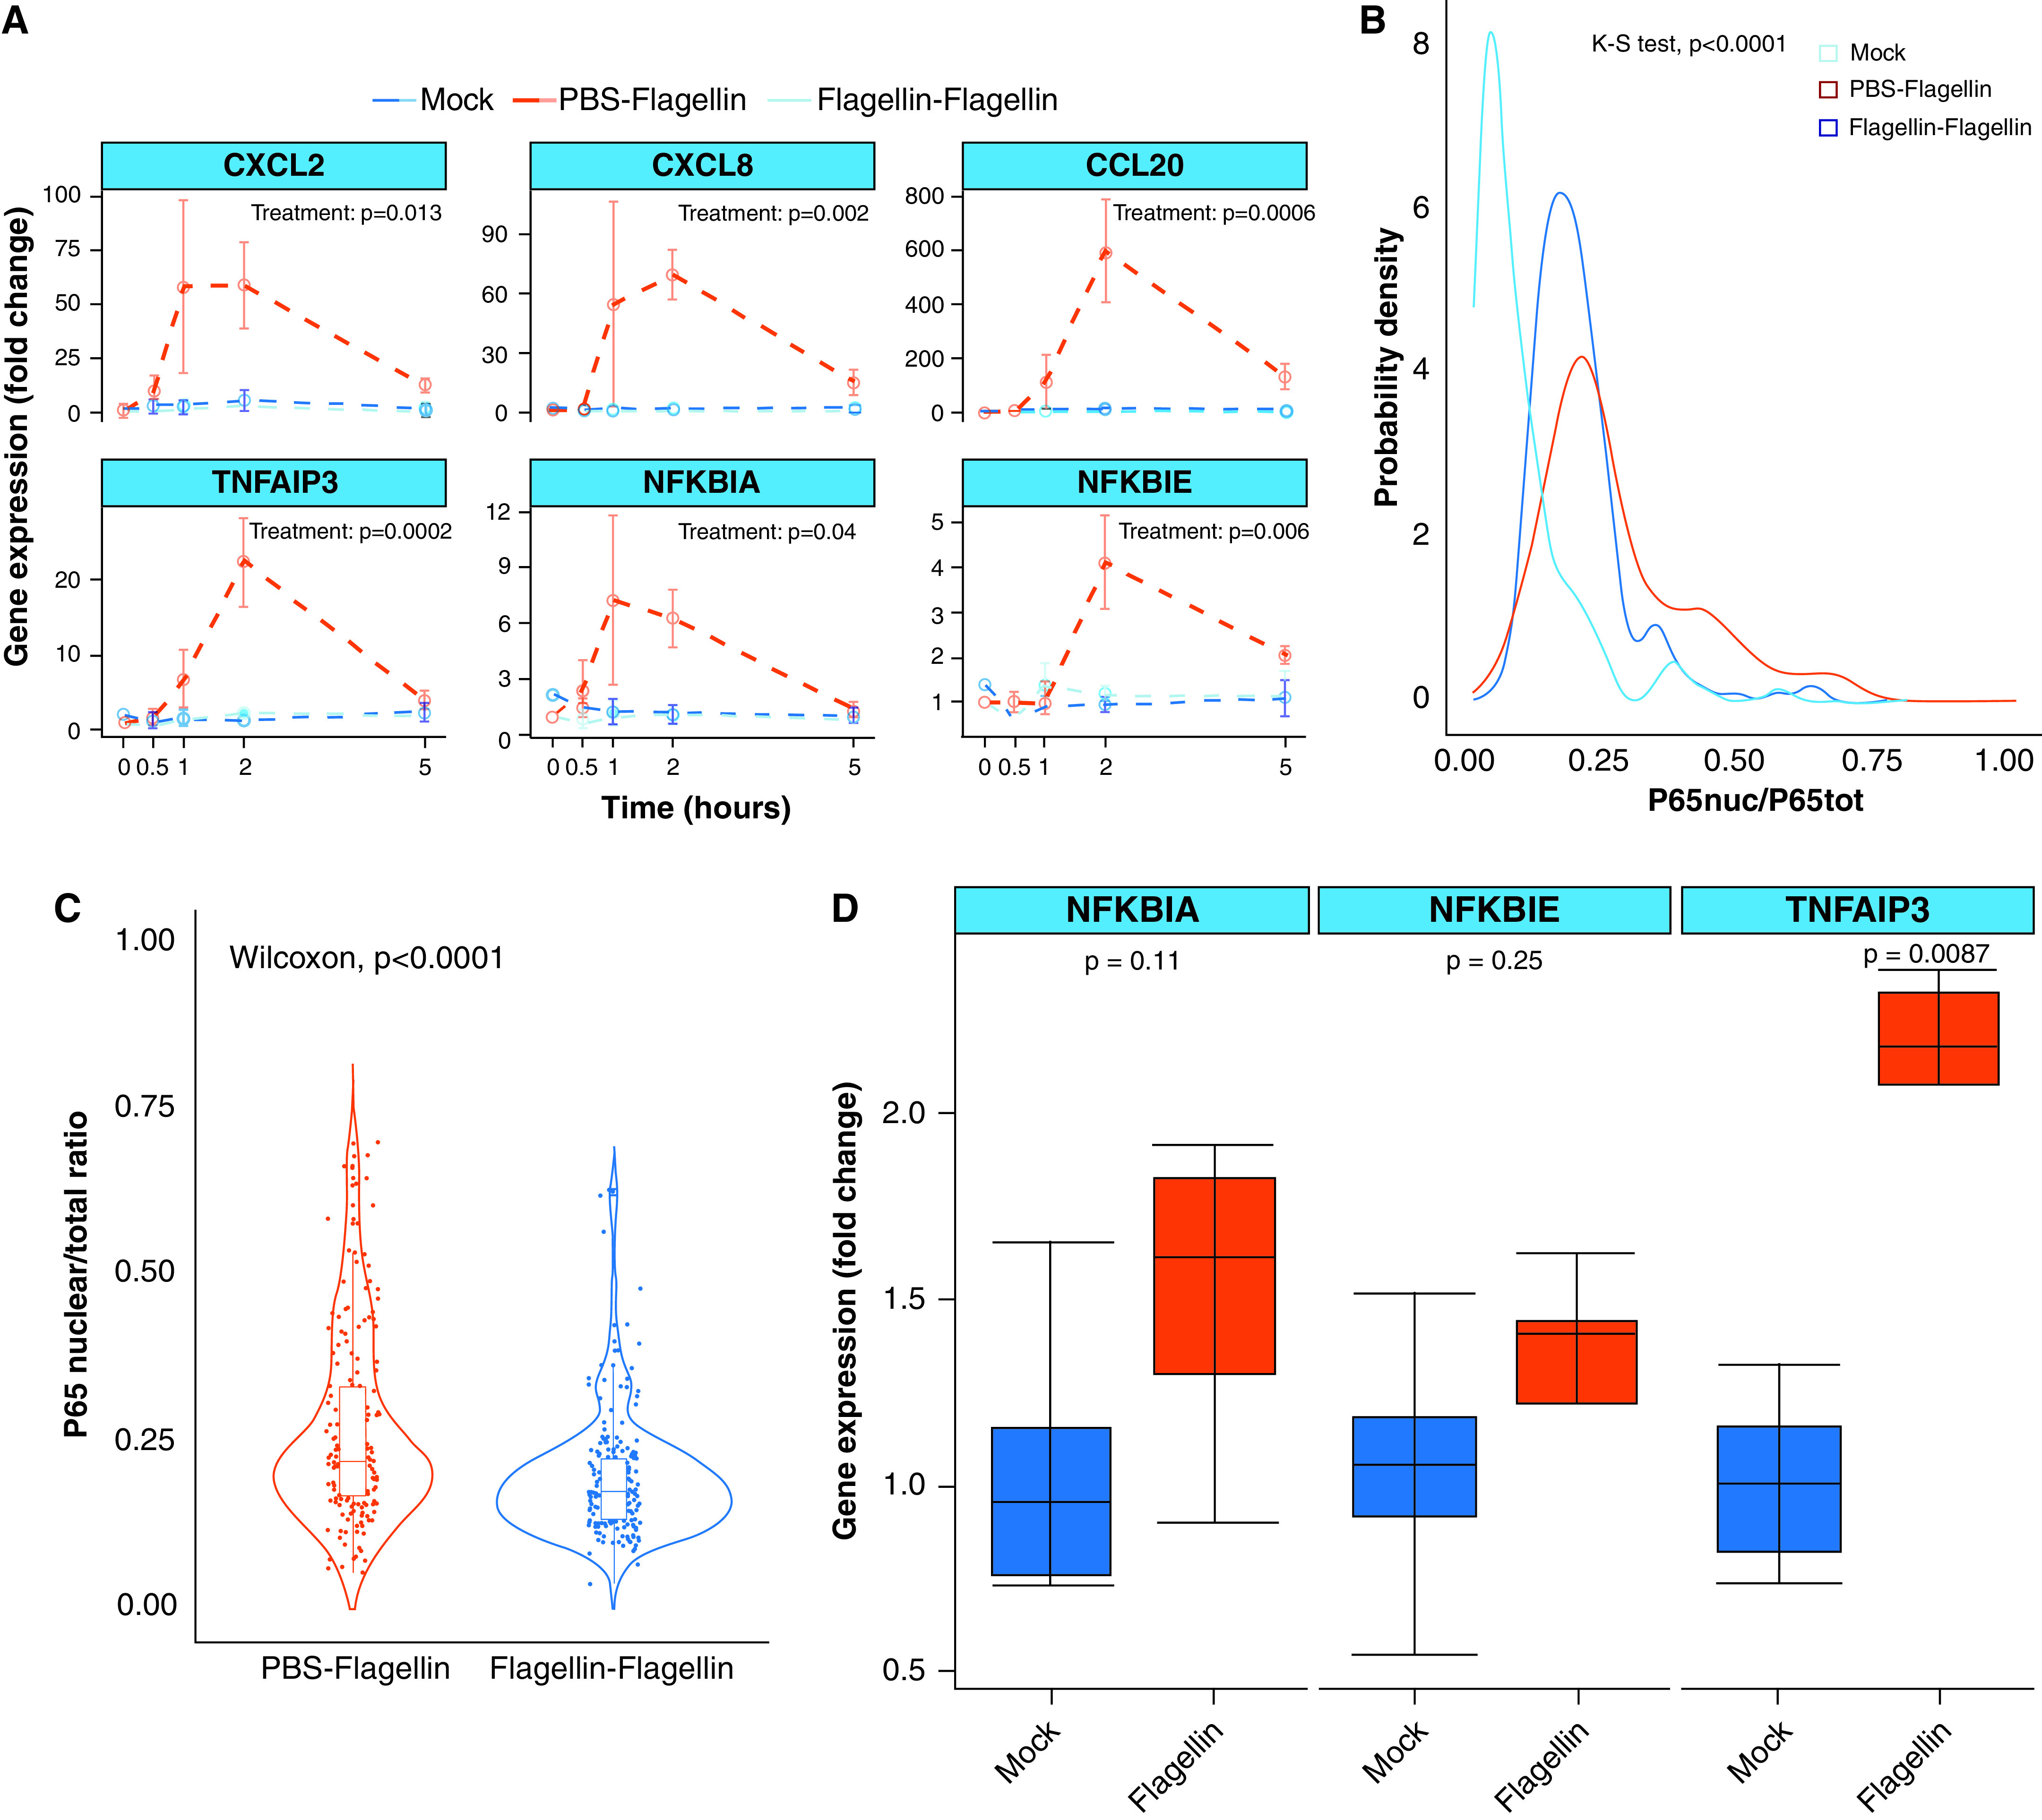
Figure 3.

Flagellin treatment decreases the TLR5 response to a second flagellin input. (A) Quantitative PCR analysis of differentiated airway epithelial cells from wild-type pigs pretreated or not with 200 μl of 100-ng/ml apical FliCΔ174–400 for 24 hours and later stimulated or not with a second flagellin input (100 ng/ml) for 0, 0.5, 1, 2, and 5 hours. “Mock” indicates PBS-treated and nonstimulated airway epithelial cells. Gene expression is shown relative to the mock group. Intergroup differences were analyzed by using two-way ANOVA with time and treatment as factors, which was followed by a Tukey honestly-significant-difference (HSD) post hoc test. Data are representative of three experiments. (B) Gaussian probability density functions and (C) violin plots for P65 nuclear translocation responses in differentiated airway epithelial cells pretreated or not with 100-ng/ml apical FliCΔ174–400 for 24 hours and later stimulated with 100-ng/ml FliCΔ174–400 for 60 minutes. Differences were evaluated by using the K-S test and the Mann-Whitney Wilcoxon test. (D) Quantitative PCR analysis of differentiated airway epithelial cells from wild-type pigs pretreated or not with 200 μl of 100-ng/ml apical FliCΔ174–400 for 24 hours. Differences were evaluated by using the Mann-Whitney Wilcoxon test. Data are representative of four to six experiments.
