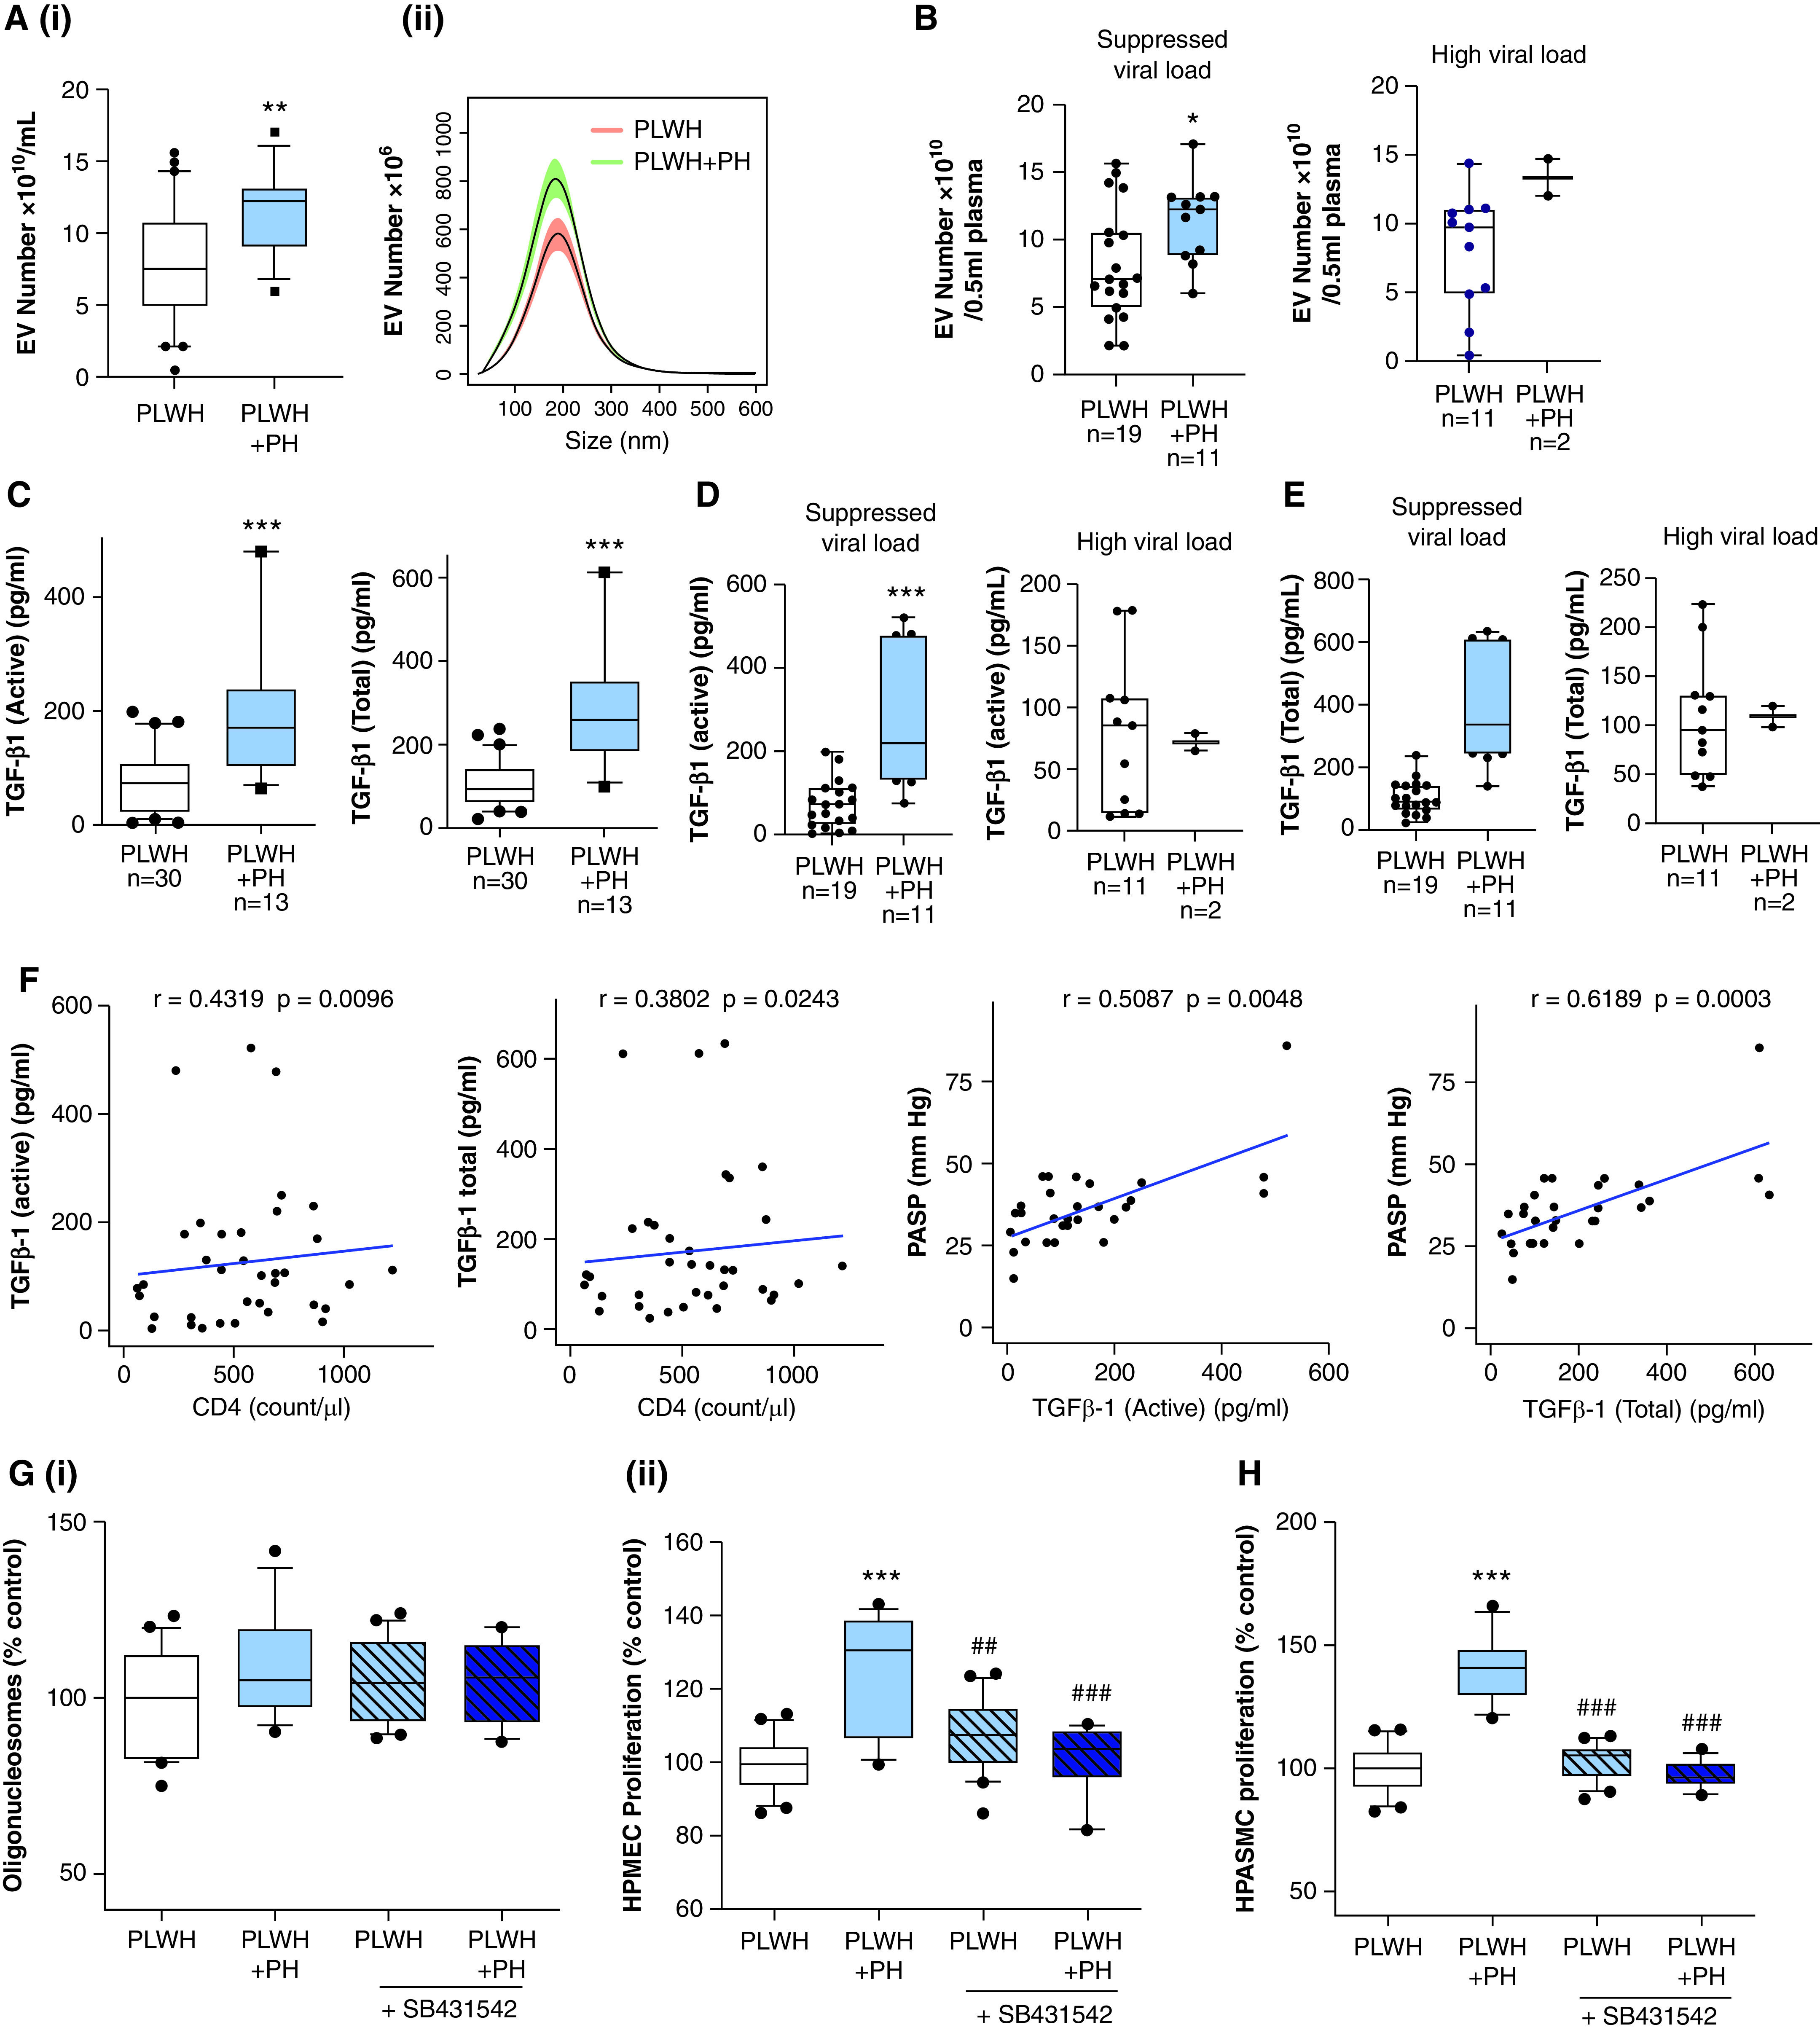
Figure 2.

TGF-β1 levels in PEVs correlate with the presence of pulmonary hypertension (PH) in HIV-positive individuals. (A) The size distribution (i) and total number (ii) of PEVs were compared between PLWH without PH (n = 30) and PLWH with PH (PLWH + PH) (n = 13) by using NanoSight. For this, PEVs from PLWH without a history of drug use (n = 15) and PLWH + Coc (n = 15) without PH were grouped as the PLWH group (n = 30). For the PLWH + PH group (n = 13), plasma samples from PLWH + PH without a history of drug use (n = 8) and PLWH + Coc with PH (n = 7) were included (Table 1). (B) EV numbers in PLWH and PLWH + PH when segregated on the basis of the viral load (high viral load, ⩾50 copies/ml plasma). (C–E) Levels of active and total TGF-β1 in PEVs as analyzed by using an ELISA. (F) Correlation analysis of EV-linked TGFβ1 (active and total) with PASP and CD4 cell count. (G) To compare the effect of PEVs from PLWH + PH and PLWH without PH on the survival and proliferation of endothelial cells, HPMECs were treated with PEVs in the presence and absence of 10μM SB431542 (TGFβ-R1 In.) (n = 13–15/group), which was followed by performance of a cell-death ELISA (i) and an MTS assay (ii) at 24 hours and 48 hours after treatment. (H) Cell proliferation analysis of quiescent HPASMCs treated with PEVs from PLWH + PH and PLWH without PH at 48 hours after treatment in the presence and absence of 10μM SB431542 (TGFβ-R1 In.). For box and whisker plots, boxes represent the median and IQR, and whiskers show the 10th to 90th percentiles. *P < 0.05, **P < 0.01 and ***P < 0.001 versus PLWH; and ##P < 0.01 and ###P < 0.001 versus PLWH + PH without TGFβ-R1 In. PASP = pulmonary arterial systolic pressure.
