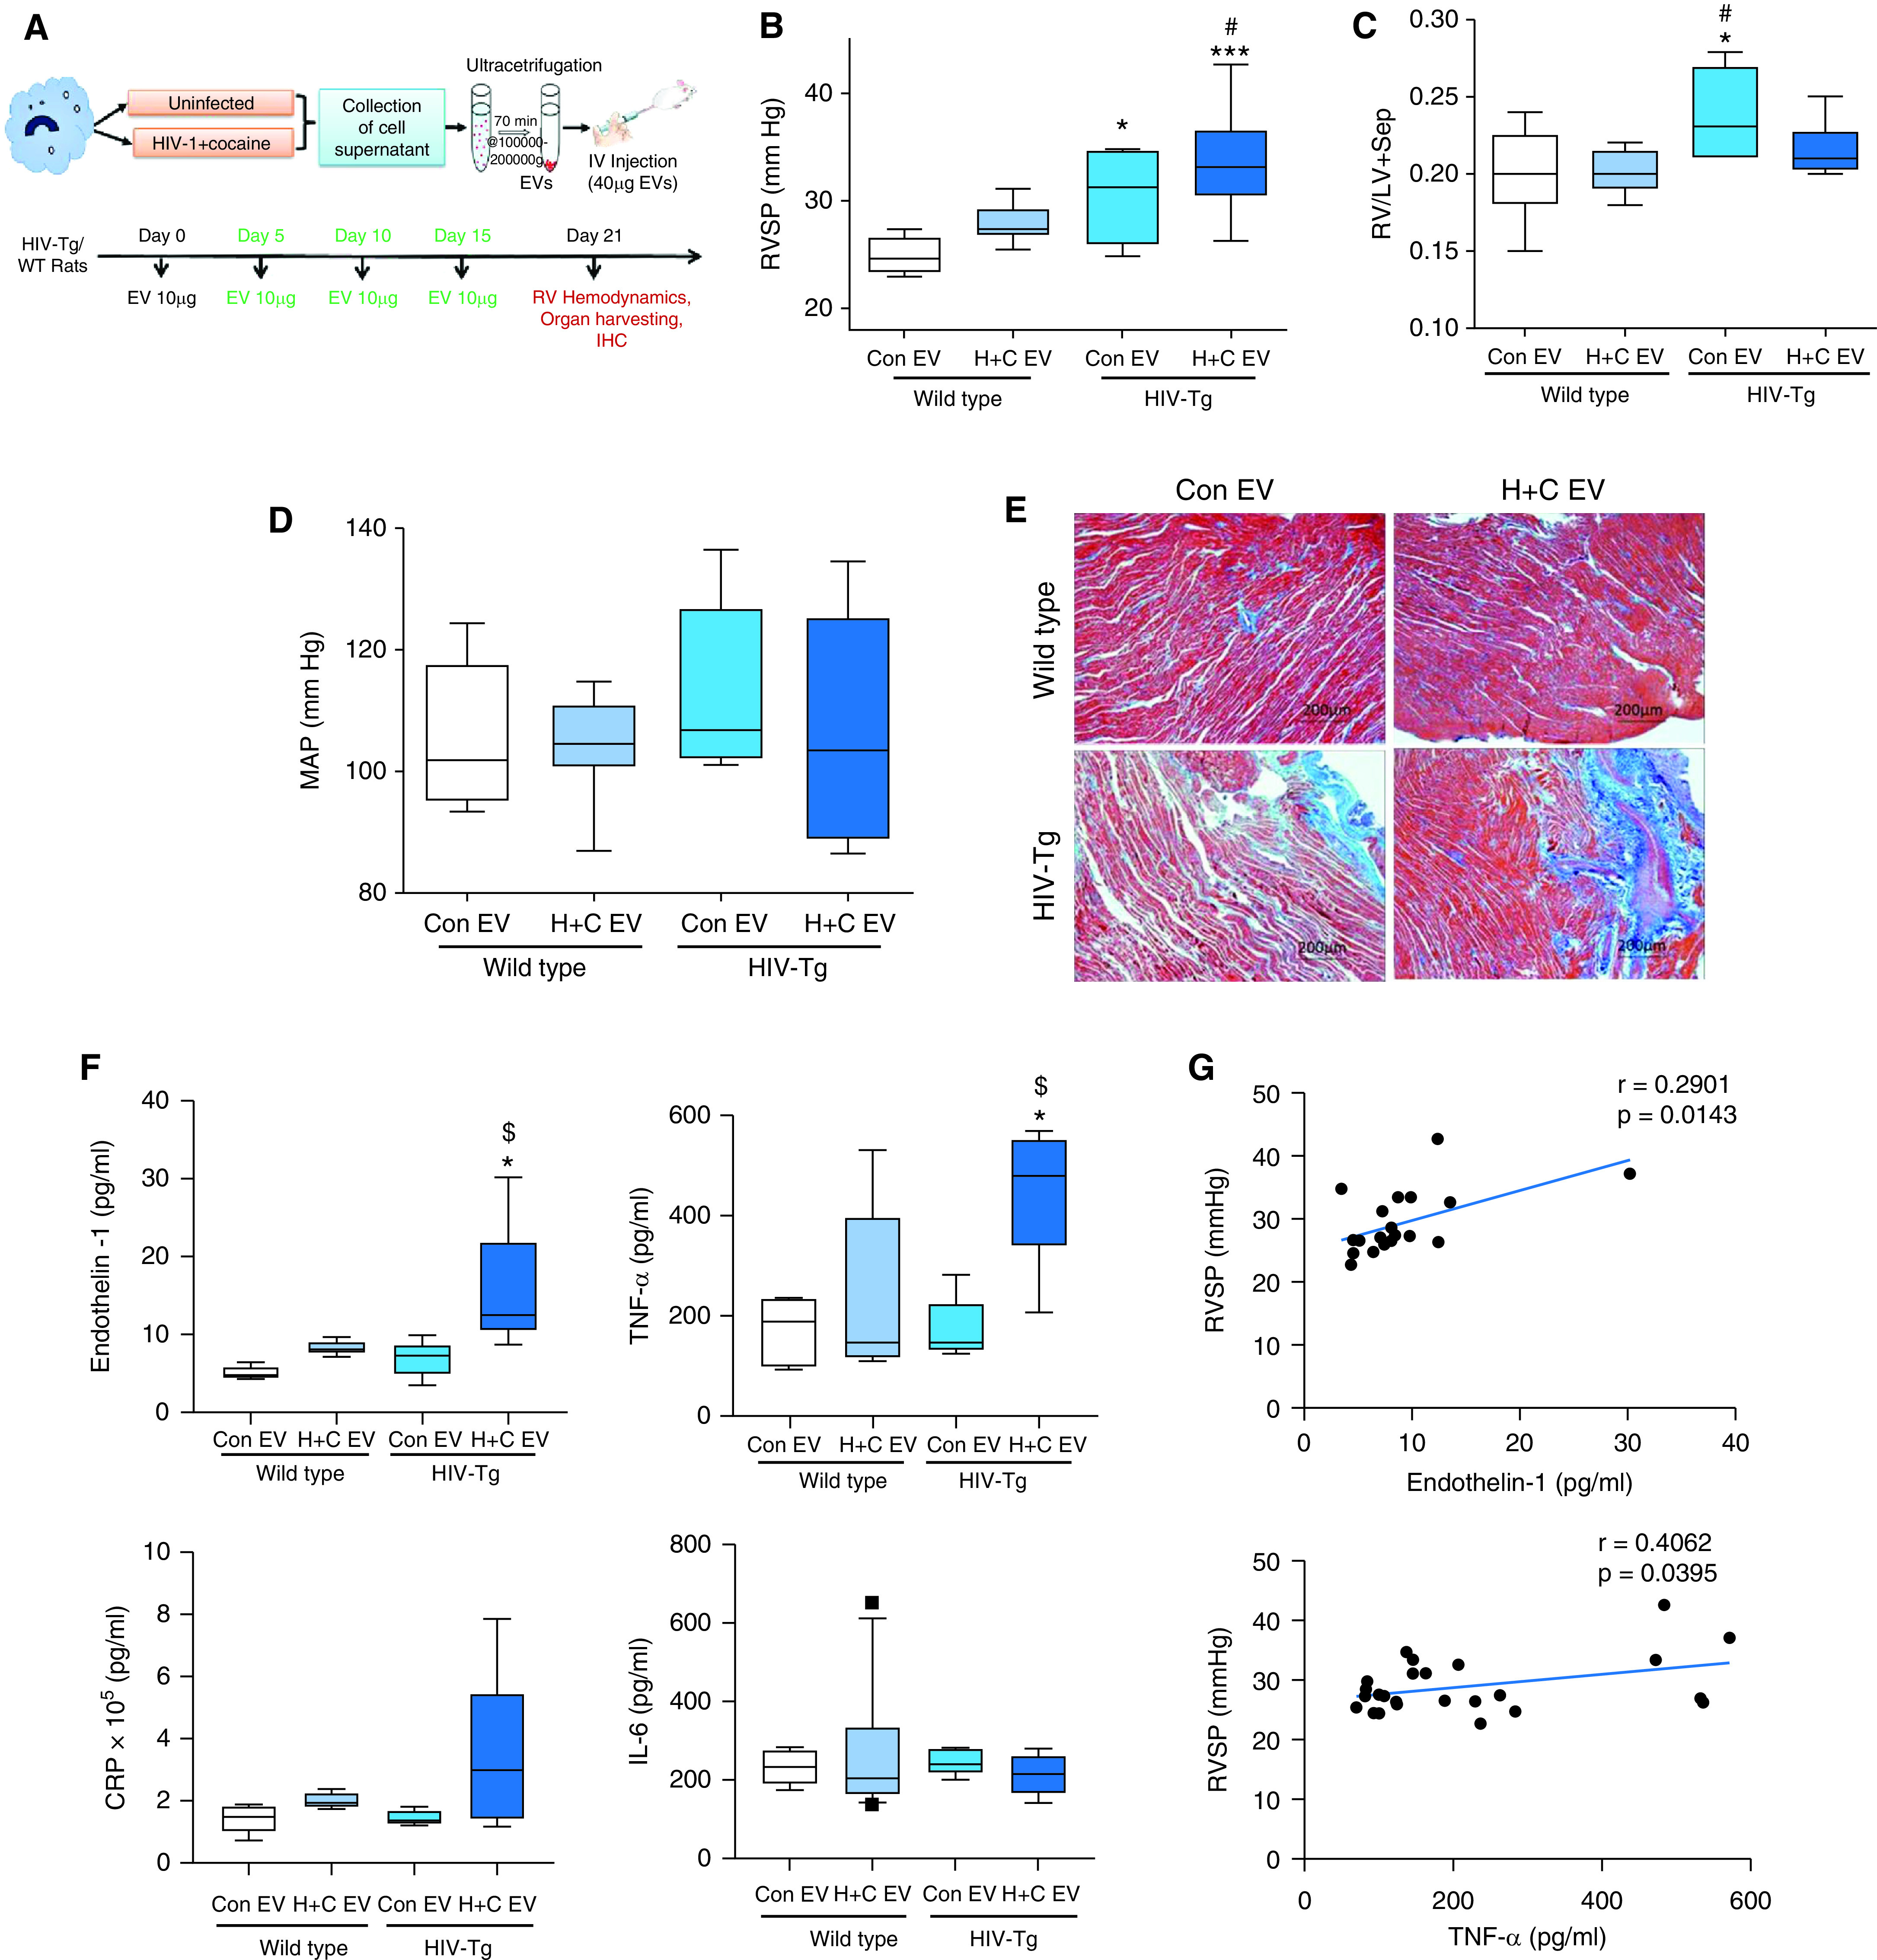
Figure 4.

Hemodynamic measurements, right ventricle (RV) fibrosis, and biomarkers of PH in rats injected with H + C MDM EVs. (A) Figure showing the timeline for the administration of H + C MDM EVs (H + C EVs) in wild-type (WT)/HIV-transgenic (HIV-Tg) rats. HIV-Tg/WT rats injected with EVs from UI MDMs (Con EVs) were used for comparison. Rats were IV injected with four doses of 10 μg of EVs each at 5-day intervals. (B–D) Box and whisker plots showing RV systolic pressure (RVSP) (B), Fulton index (C), and MAP measurements (D). (E) Representative micrographs show RV fibrosis after Masson's trichrome staining on formaldehyde-fixed, paraffin-embedded RV sections. Scale bars, 200 mm. (F) ELISAs were performed to assess serum levels of endothelin-1, TNF-α, CRP (C-reactive protein), and IL-6. (G) Graphs showing correlation of RVSP with endothelin-1 and TNF-α serum levels in rats. n = 6–8 rats per group. Box and whisker plots show the median value and 10th to 90th percentiles. *P < 0.05 and ***P < 0.001 versus WT Con EV; #P < 0.05 versus WT H + C EV; and $P < 0.05 versus HIV-Tg Con EV. IHC = immunohistochemistry; IV = intravenously; MAP = mean arterial pressure.
