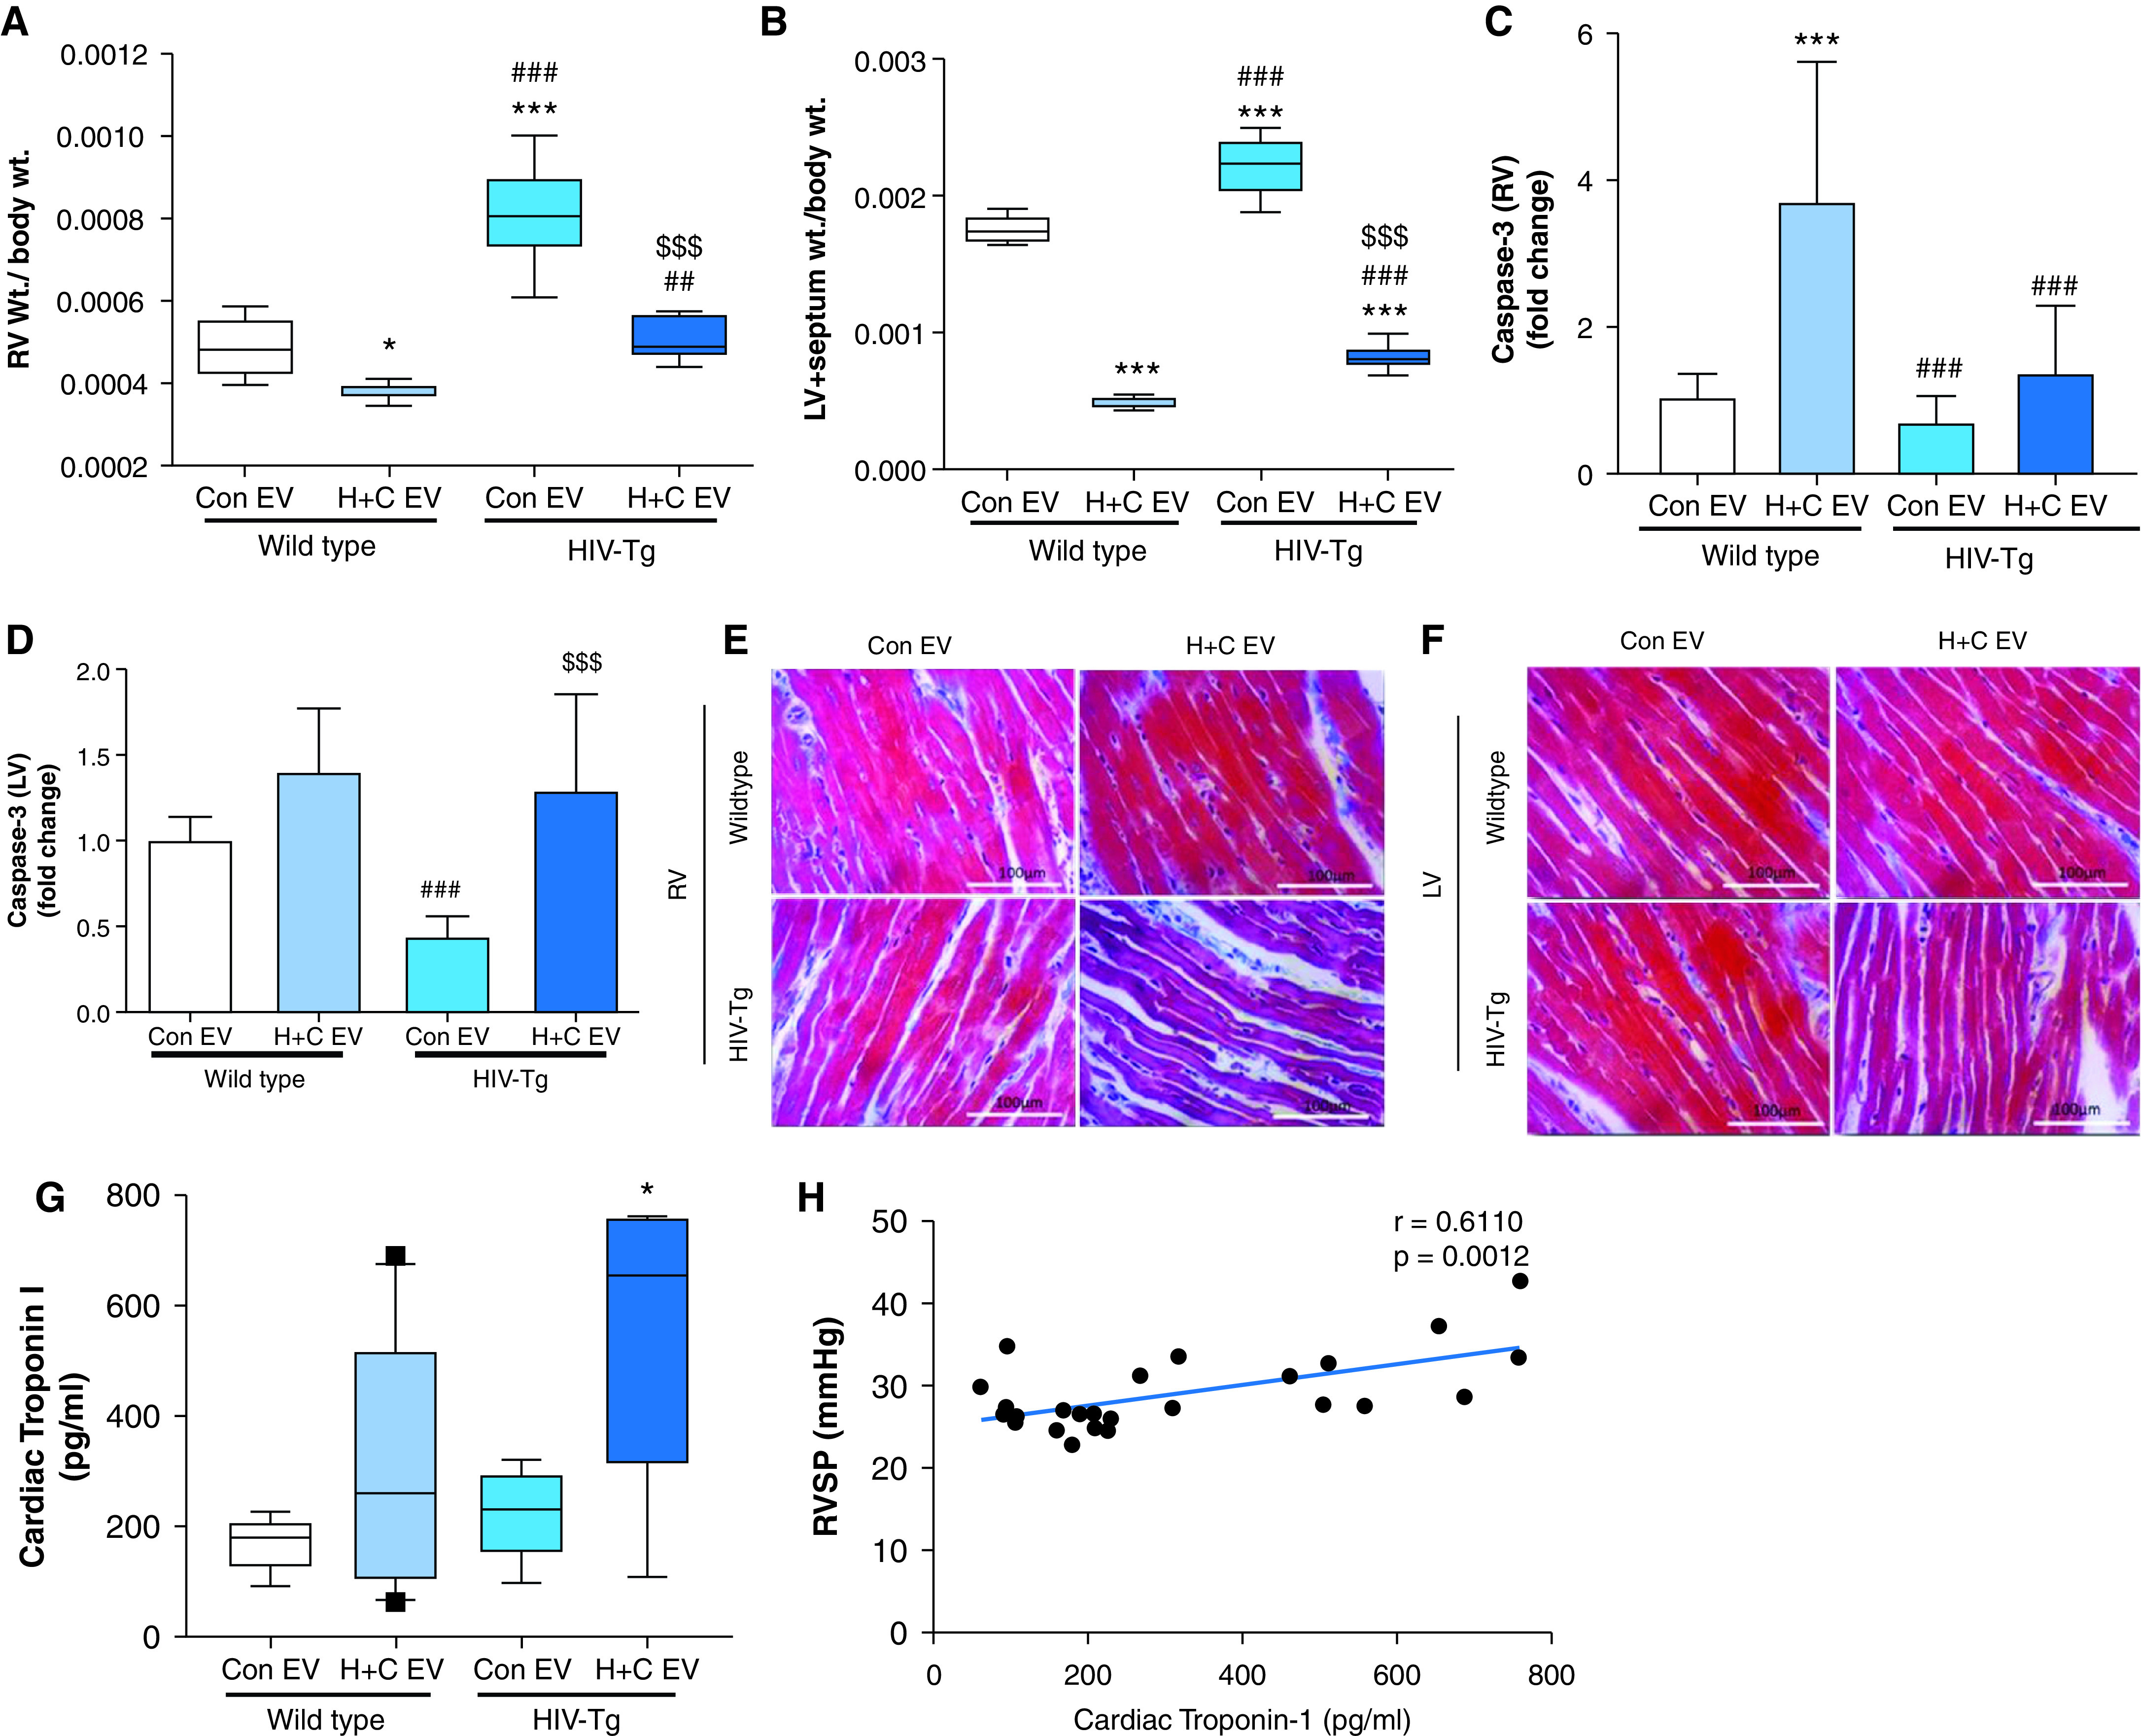
Figure 5.

Analysis of cardiac atrophy in rats injected with EVs from H + C macrophages. (A and B) Ratio of RV weight to total body weight (A) and left ventricle (LV) + septum weight to body weight (B) for WT and HIV-Tg rats injected with EVs from UI MDMs (Con EVs) or EVs from H + C MDMs (H + C EVs). Values are from n = 7–8 rats per group. (C and D) Quantitative RT-PCR analysis of caspase-3 in the RV (C) and LV (D) tissues from rats (n = 6/group). The values are expressed as the fold change. (E and F) Representative micrographs showing RV (E) and LV (F) cardiomyocytes from all four groups after Masson's trichrome staining. Scale bars, 100 mm. (G) ELISA was performed to check the levels of cardiac troponin-1 in rat serum from all groups. Values are from n = 7–8 rats per group. (H) Graph showing correlation of RVSP with cardiac troponin-1 levels in rats. For box and whisker plots, boxes represent the median and IQR, and whiskers show the 10th to 90th percentiles. *P < 0.05 and ***P < 0.001 versus WT Con EVs; ##P < 0.01 and ###P < 0.001 versus WT H + C EVs; and $$$P < 0.001 versus HIV-Tg Con EVs.
