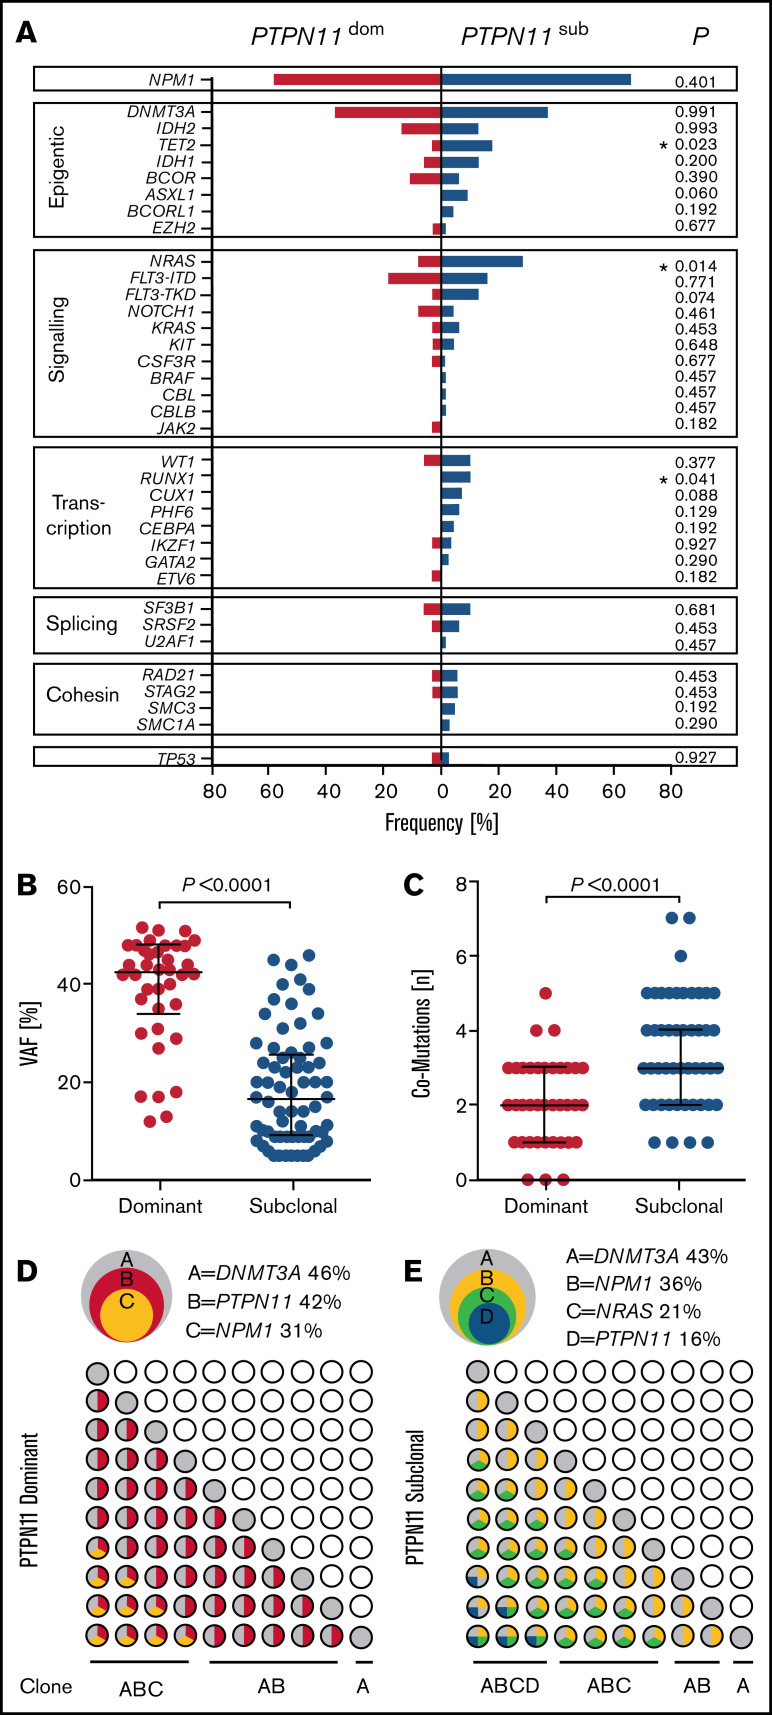
Figure 4.
Correlations of PTPN11 clonal hierarchy with molecular features. (A) Rates of associated comutations in patients with PTPN11 mutations in subclonal (PTPN11SUB; blue) and dominant (PTPN11DOM; red) configuration. Significant differences are indicated. (B) VAFs of subclonal (n = 68) and dominant (n = 38) PTPN11 mutations. (C) Overall number of comutations associated with subclonal (n = 68) and dominant (n = 38) PTPN11 mutations. (D-E) Schematic illustration of representative clonal hierarchies (depicted from VAFs of PTPN11 mutations and comutations) in PTPN11DOM (D) and PTPN11SUB (E) AMLs of 2 PTPN11-mut patients (overlapping circles, top) and potential sequential acquisition of PTPN11 mutations (and comutations) as early (PTPN11DOM) or late (PTPN11SUB) event during clonal evolution (grid of circles, bottom).

