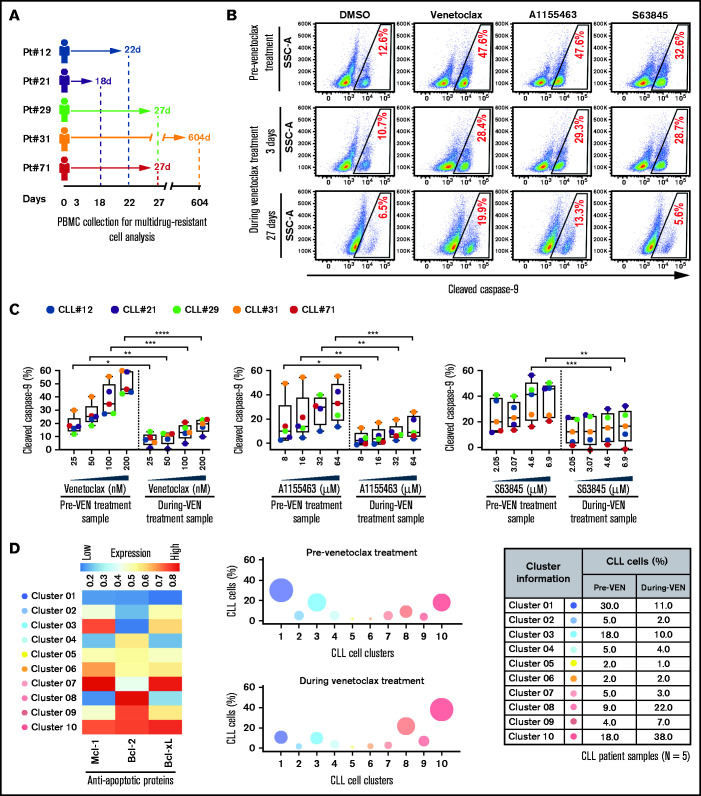
Figure 4.
Surviving persister cells in venetoclax-treated patients with CLL are enriched for leukemic B cells displaying functional and molecular properties of multidrug resistance. (A) Schema of the studied patients with CLL (supplemental Table 4) with timing of sample collections taken before and during venetoclax treatment. (B-C) PBMCs of patients with CLL isolated prior to or during treatment with venetoclax were analyzed for multidrug resistance in ATA by incubating ex vivo with inhibitors of Bcl-2 (venetoclax; 25, 50, 100, or 200 nM), Bcl-xL (A1155463; 8, 16, 32, or 64 µM), or Mcl-1 (S63845; 2.05, 3.07, 4.6, or 6.9 µM) for 3 hours without agonists. (B) Representative flow images showing caspase-9 cleavage in CLL (viability dye−/CD5+/CD19+) cells following ex vivo incubation with venetoclax (200 nM), A1155463 (64 μM), or S63845 (6.9 μM) of a patient PBMC (patient 71) taken prior to or at 3 and 27 days of treatment with venetoclax. (C) Percentage CLL cells positive for cleaved caspase-9 following ex vivo incubation with venetoclax, A1155463, or S63845 of multiple PBMCs of patients with CLL (N = 5) taken prior to or during treatment with venetoclax, as shown in panel A. Data are presented after subtracting spontaneous apoptosis values from DMSO treatment controls. (D) The expression of antiapoptotic proteins in PBMCs of patients with CLL (N = 5) taken prior to or during treatment with venetoclax was analyzed by FCM. FCS files were generated from pregated CLL (viability dye−/CD5+/CD19+) cells, and cell clusters expressing different levels of antiapoptotic proteins in before and during therapy samples were identified using an unsupervised clustering analysis as described in Figure 1C. A heatmap was generated based on GMFLI values to show expression of various antiapoptotic proteins in different clusters (left). Clusters were visualized using a bubble graph in which every bubble represents 1 cluster and the area of the bubble (size) is proportional to the mean percentage of cells in that cluster (middle). A table showing mean percentage cells in every cluster in samples taken before and during venetoclax treatment (right). The mean percentage of cells in a cluster was determined by calculating the average for that cluster across patients analyzed (N = 5). Statistical significance was determined by ANOVA with Sidak’s post-hoc test for multiple comparisons. *P < .05; **P < .01; ***P < .001; ****P < .0001. Data are presented as mean ± SD. Pt, patient; VEN, venetoclax.

