Figure 3.
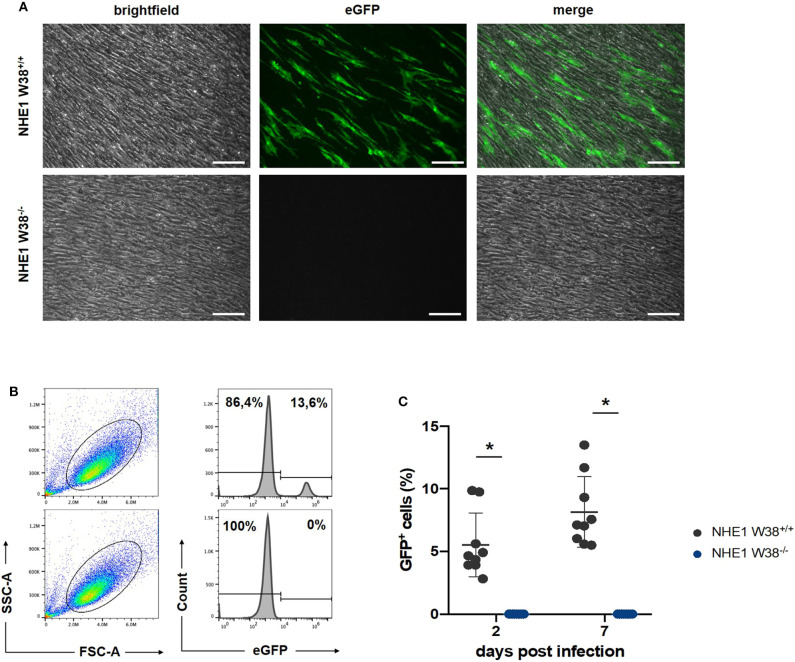
Resistance of NHE1 W38−/− mutants to ALV-J compared to NHE1 W38+/+. Infection experiment of NHE1 W38+/+ and NHE1 W38−/− chicken embryonic fibroblasts with RCAS(J)eGFP. Infection of the eGFP expressing virus was assessed by microscopy on 14 dpi (A) and by flow cytometry on 2 and 7 dpi (B,C). (A) Microscopy shows a representative replicate of infected NHE1 W38+/+ and NHE1 W38−/− CEFs (Scale bar = 100 μm). (B) Flow cytometrical data on 7 dpi. CEFs were gated depending on side- and forward scatter (SSC/FSC) and examined for eGFP fluorescence intensity. Upper panels show infected NHE1 W38+/+ and lower panels display NHE1 W38−/− CEFs. (C) Comprehensive data of eGFP quantification by flow cytometry on 2 and 7 dpi. Black dots represent NHE1 W38+/+ (2 dpi 5.5%; 7 dpi 8.1%) and blue dots NHE1 W38−/− (2 dpi and 7 dpi 0%). Infections were carried out in triplicates in three independent experiments for the indicated cell lines. Standard deviation (SD) is indicated by error bars. Statistical analysis was performed using Mann–Whitney-U-Test (*p < 0.05).

