Figure 3.
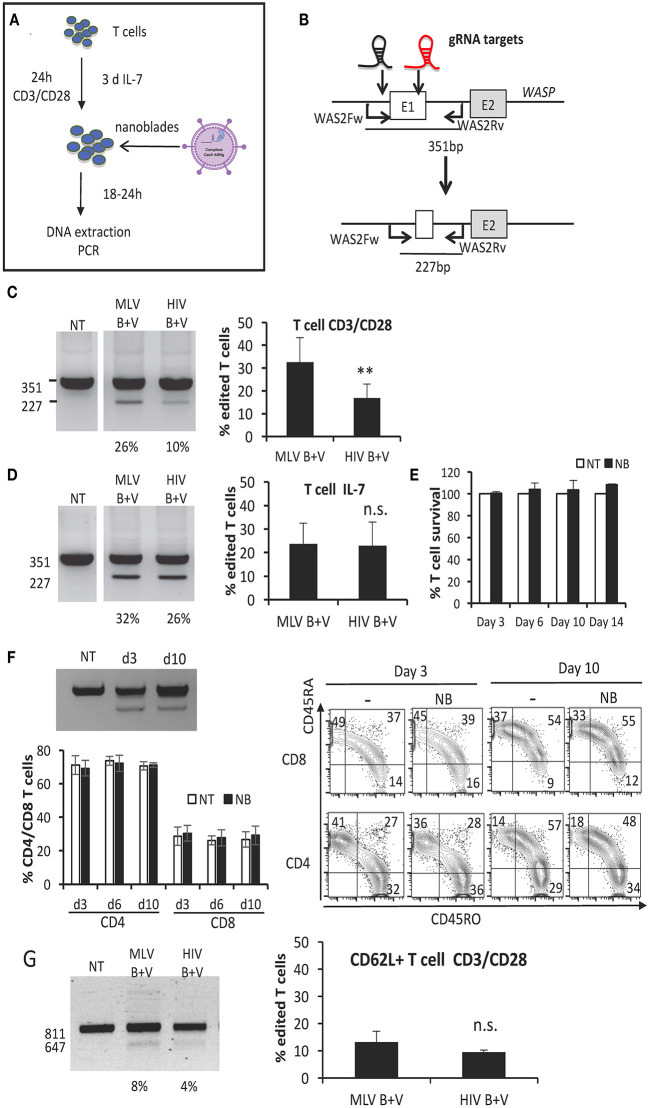
BaEV/VSV-G gp displaying nanoblades allow efficient gene-editing in human T cells. (A) Outline of T cell activation and incubation with nanoblades for evaluation of CRISPR/CAS9 gene editing. (B) Schematic representation of expected band sizes of the PCR products using the WAS2Fw/WAS2Rv primer pair without cleavage (351 bp) and after gene-edited deletion into the WAS gene (227 bp); gRNA-301 and−305 target sites are indicated as black and red gRNA, respectively. CD3/CD28 activated (C) or IL-7 stimulated (D) T cells transduced with MLV- or HIV-based nanoblades co-pseudotyped with BAEV- and VSVG-gps (B + V) in the presence of retronectin. (C,D) Representative electrophoresis gels of the PCR products using the WAS2Fw/WAS2Rv primer pair; percentage of edited T cells is indicated under each lane (left) and summarizing graph showing percentage of gene editing (right) (means ± SD, MLV B + V n = 3, HIV B + V n = 3; student t-test, **p < 0.01, n.s, not significant). Survival (E) and gene editing (F) over time are shown for IL-7 stimulated T cells incubated with MLV nanoblades or not (NT) and continued in culture in the presence of IL-7 (means ± SD, NT n = 3, NB n = 3). Cell survival was determined by DAPI staining and is shown for the nanoblade treated cells (NB) relative to the not treated cells (NT), for which cell survival was set to 100%. (F) The percentage of CD4 and CD8 T cells is shown and a representative electrophoresis and flow cytometry plot are shown for CD45RO and CD45RA phenotyping for day 3 and 10 of IL-7 stimulated T cells incubated with MLV nanoblades or not (NT) and continued in culture in the presence of IL-7 (means ± SD, NT n = 3, NB n = 3; electrophoresis gel and flow cytometry plot: representative of n = 3). (G) CD3/CD28 activated purified CD62L+ T cells transduced with MLV- or HIV-derived nanoblades, co-pseudotyped with BaEV- and VSVG-gps (B + V) in the presence of retronectin. Representative electrophoresis gels of the PCR products using the WASFw/WASRv primer pair (see Figure 2B); the percentage of edited CD62L+ T cells is indicated under each lane (left) and graph summarizing percentage of gene editing (right) (means ± SD, MLV B + V n = 3, HIV B + V n = 3; n.s., not significant).

