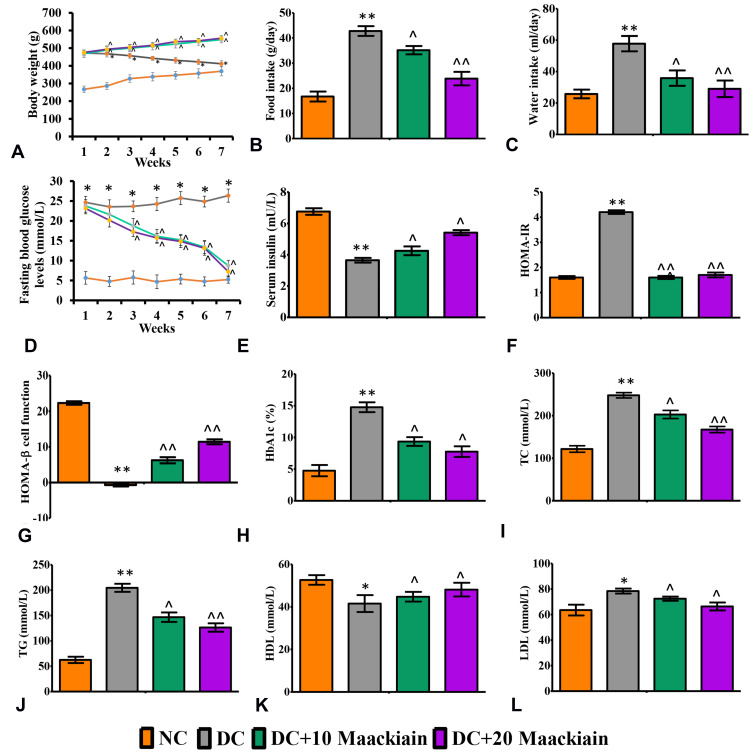
Figure2.
The effects of maackiain metabolic parameters in HFD & low STZ induced diabetic rats. (A) Weekly body weights; (B) Food intake; (C) Water intake; (D) Fasting blood glucose levels (FBG); (E) serum insulin; (F) HOMA-IR; (G) HOMA-β cell function; (H) Glycated hemoglobin (HbA1c); (I) Total cholesterol (TC); (J) Triglycerides (TG); (K) High density lipoproteins (HDL); (L) Low density lipoproteins (LDL). The data were expressed as the mean ± S.D, n=6, **p < 0.001 and *p < 0.05 versus NC; ^^p<0.001 and ^p< 0.05 versus DC.
Abbreviations: NC, normal control; DC, diabetic control; DC+10 maackiain, 10 mg/kg/bw maackiain treated diabetic rats; DC+20: 20 maackiain, 20 mg/kg/bw maackiain treated diabetic rats.

