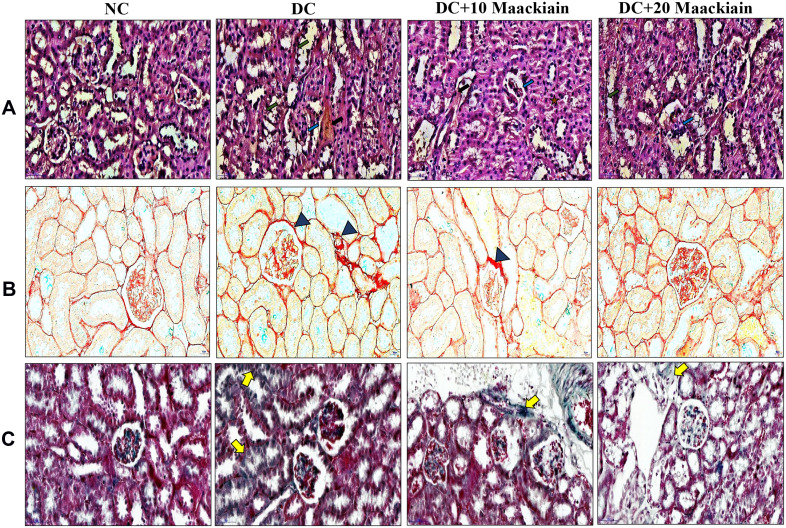
Figure4.
The effects of maackiain histopathology in HFD & low STZ induced diabetic rats. (A) Hematoxylin and Eosin (H&E) staining; (B) Picro Sirius Red (PSR) staining; (C) Masson’s Trichrome (MT) staining; H& E(Black color arrow shows necrosis, Green color arrow shows thickened glomerular basement membrane, blue color arrow shows increased glomerular space). PSR and MT (Blue color triangle shows collagen deposition and yellow color arrow also shows collagen deposition). Magnification = x40; Scale bar = 100µm.
Abbreviations: NC, normal control; DC, diabetic control; DC+10 maackiain, 10 mg/kg/bw maackiain treated diabetic rats; DC+20: 20 maackiain, 20 mg/kg/bw maackiain treated diabetic rats.

