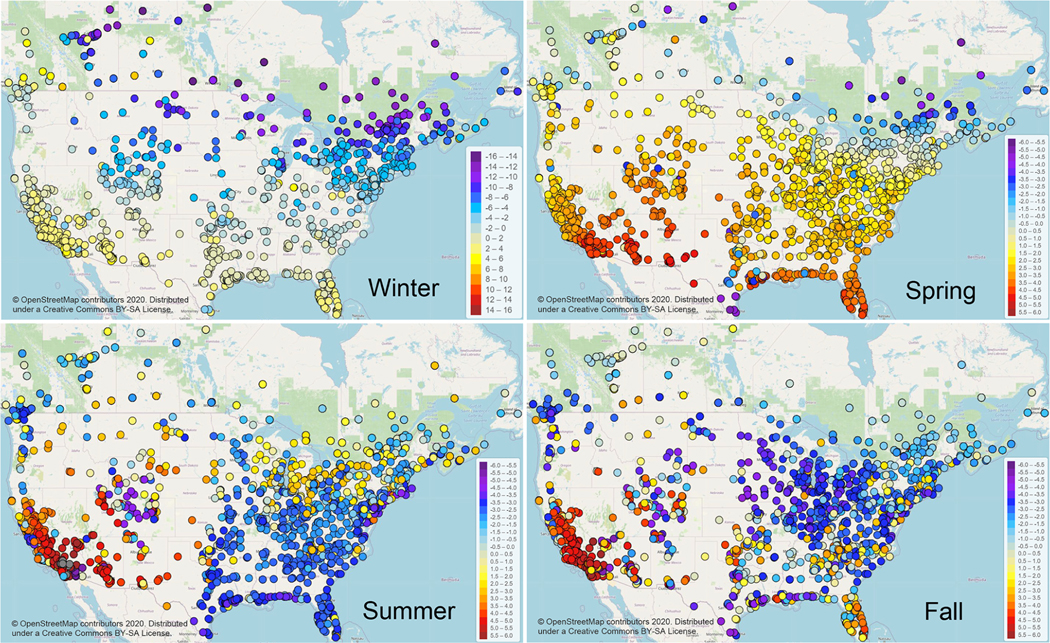
Figure 6.
Seasonal average MDA8 O3 absolute bias difference (ppbv) between the CMAQ521 and CMAQ531_WRF38_M3Dry_BiDi simulations for all AQS and NAPS sites. Cool shading (negative values) indicates a smaller bias in the CMAQ531_WRF38_M3Dry_BiDi simulation, warm colors (positive values) indicates a smaller bias in the CMAQ521 simulation. Note that the scale is different for the winter season. Grey shading indicates values beyond the range of the scale.

