. 2021 Feb 19;21(7):1333–1351. doi: 10.1039/d0lc01216e

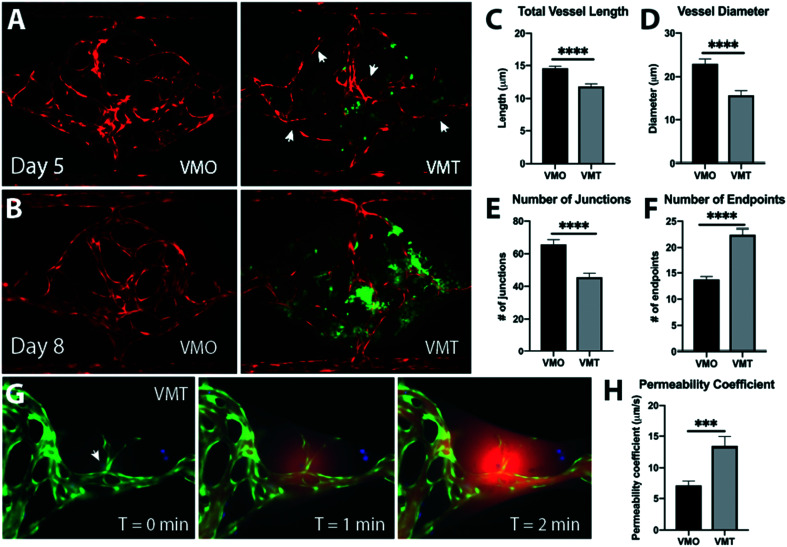
Fig. 2. The VMT models key features of in vivo tumor vasculature. (A) Comparison of VMO and VMT on day 5 and (B) day 8 shows irregular vasculature in the VMT that becomes more prominent as the tumor grows. Arrowheads show skinny, non-perfused vessels as areas of vascular disruption in the VMT. EC (mCherry, red), HCT116 cancer cells (GFP, green). (C) Quantification of total vessel length, (D) vessel diameter, (E) number of junctions and (F) number of endpoints, all are mean and SD, n = 12. Statistical significance was calculated by unpaired t-test. (G) Fluorescent image at T = 0 min shows angiogenic sprouts near an HCT116 tumor cluster (arrowhead). EC (GFP, green), HCT116 cancer cells (azurite, blue). Perfusion with 70 kD rhodamine dextran at T = 1 min and T = 2 min reveals a significant leak from the tumor-associated vessel. (H) Quantification of the permeability coefficient shows that the VMT is twice as leaky as the VMO. Mean and SD, n = 12. Statistical significance was calculated by unpaired t-test. ***p < 0.0001, ***p < 0.00001.

Fig. 2