. 2021 Feb 19;21(7):1333–1351. doi: 10.1039/d0lc01216e

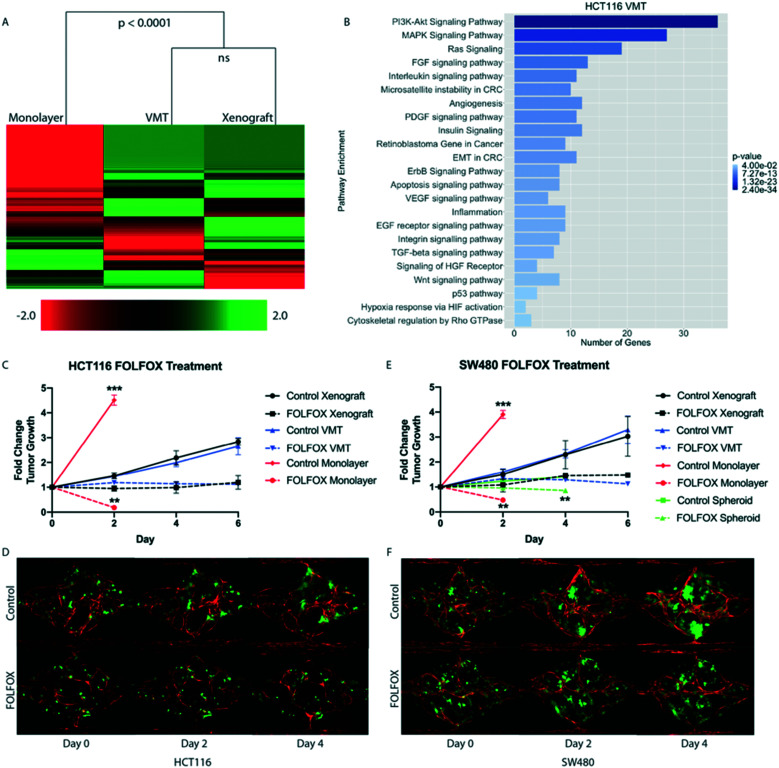
Fig. 3. Comparison of gene expression, tumor growth and response to drug treatment between VMT, 2D and 3D monocultures and xenograft tumors. (A) Nanostring cancer panel of 770 cancer-related genes in HCT116 CRC cell line-derived monolayers, VMT and xenograft tumors. (B) Pathways enriched with differentially expressed genes comparing VMT and xenograft tumor. (C) Growth curves of HCT116 cells grown in monolayer, in mice or in the VMT and treated with standard of care, FOLFOX. Mean and SD shown, n = 16. Statistical significance was calculated by unpaired t-test. See Methods for a description of how tumor size was calculated in each geometry. (D) Representative images of HCT116-VMT (vessels red, tumor cells green). (E) Growth curves of SW480 cells in monolayer, spheroids, VMT and mice treated with FOLFOX. Mean and SD shown, n = 16. Statistical significance was calculated by unpaired t-test. (F) Representative images of SW480-VMT. **p < 0.001, ***p < 0.0001.

Fig. 3