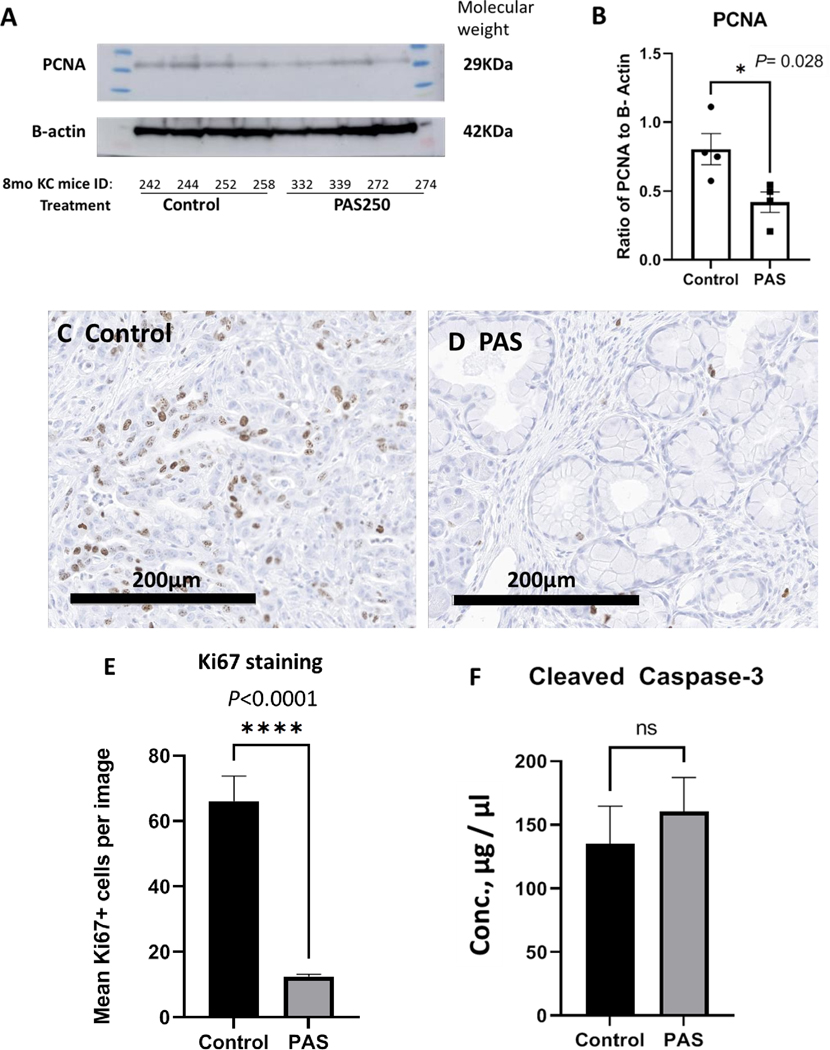
Figure 5.

PAS- therapy decreases proliferation of the mouse KRAS pancreas. A, Western blot of protein extracts from mouse pancreas reacted with the antibody to the proliferating cell nuclear antigen (PCNA) is show at the expected 29KDa size. The protein is normalized to actin with the band shown at the expected 42KDa size. Mouse identification numbers are shown below the blot and protein ladder size exhibited on each side of the samples electrophoresed. B, The western blot was analyzed by densitometry and the individual samples (dots & squares) and mean ± SEM values (Columns, error bars) show a significant decrease in PCNA immunoreactivity in tissue from PAS-treated mice (P=0.028). C, Representative image from the pancreas of a control mouse reacted with a Ki67 antibody shows numerous immunoreactive proliferating cells. D, A representative image is shown from the pancreas of a PAS-treated mouse with Ki67 staining. E, Quantitative analysis of Ki67 immunoreactive cells is shown. Columns represent the mean number of Ki67+ cells counted per high power (200μm) image with N=10 images per slide. The number of Ki67+ proliferating cells is significantly increased in the pancreas tissue of control mice compared to the pancreas tissue from PAS-treated mice (P<0.0001). F, Columns represent the mean ± SEM of pancreatic protein cleaved caspase-3 levels in μg/μl as measured by ELISA revealed no significant difference between control and PAS-treated mice.
