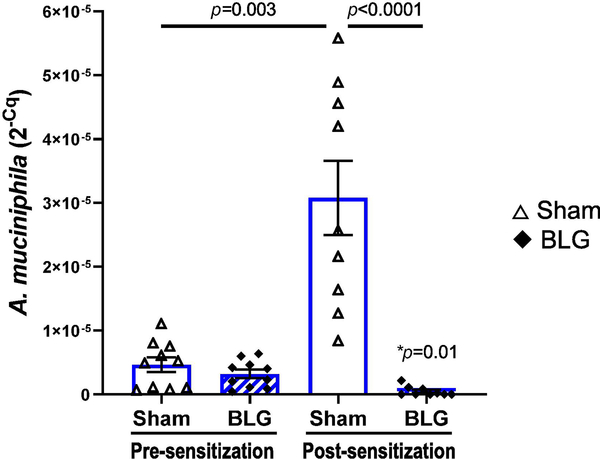
Figure 10. Differences in the amount of A. muciniphila in sham and BLG-sensitized male C57BL/6J mice before and after the sensitization procedure.
Microbial DNA samples were isolated from fecal pellets that had been collected before (pre-sensitization) and after (post-sensitization) the 5-week sensitization procedure. The amount of A. muciniphila in each of the DNA samples were quantified by qPCR using a specific primer pair. Sham mice (open bars with open triangles); BLG mice (striped bars with filled diamonds). Bars indicate group averages of individual 2−Cq values ± SEM (n = 10 per group), sham vs. BLG: two-way ANOVA; treatment-matched pre- vs post-sensitization values were compared using paired t-test. *p=0.01 indicates comparison between pre- and post-sensitization BLG.

