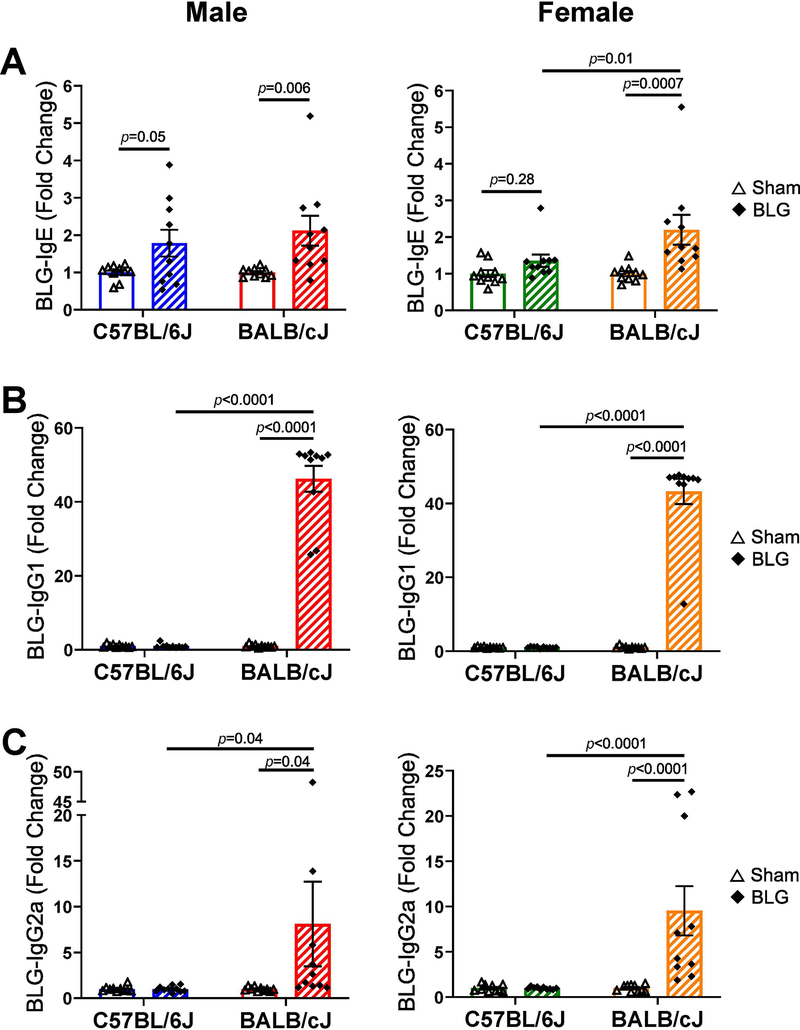
Figure 3. Serum levels of BLG-specific immunoglobulin isotypes.
Terminal blood samples were used to detect BLG-specific serum IgE (A), IgG1 (B) and IgG2a (C) using ELISA. Fold change was calculated by normalizing optical density (OD) values obtained for BLG-sensitized groups to those for sex- and strain-matched sham groups. Sham mice (open bars with open triangles); BLG mice (striped bars with filled diamonds); male C57BL/6J (blue); male BALB/cJ (red); female C57BL/6J (green); female BALB/cJ (orange). Bars indicate group average values in fold changes ± SEM (n = 10 per group), two-way ANOVA.

