Figure 2.
Continue.
Figure 2.
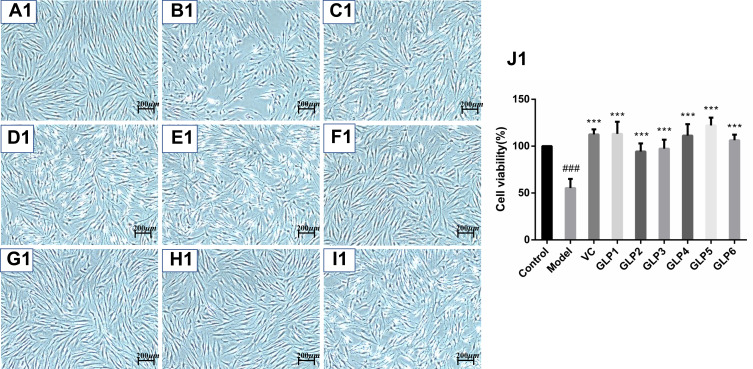
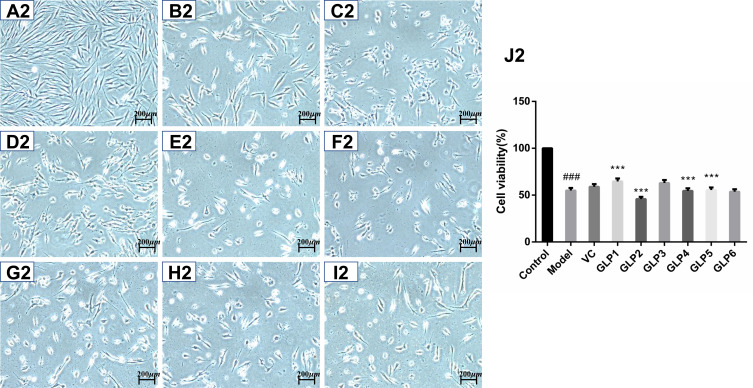
Protective and reparative effects of GLPs treated on H2O2-induced oxidative damaged HSFs. (A1–J1) shows the protective effects of GLPs. (A1) The morphology of HSFs in normal conditions (Control). (B1) The morphological changes of cells pretreated with DMEM without FBS for 24h followed by 100 μmol·L−1 H2O2 for 2 h (model). (C1) The morphology of HSFs pretreated with 86 mg·L−1 ascorbic acid (VC, considered as a positive control) followed by 100 μmol·L−1 H2O2 for 2 h. (D1–I1) The morphology of HSFs pretreated respectively with GLP1~GLP6 at the concentration of 1.25 g·L−1 followed by 100 μmol·L−1 H2O2 for 2 h. (J1) Cell viability was determined using MTT assay. A2 to J2 shows the reparative effects of GLPs. (A2) The morphology of HSFs in normal conditions (Control). (B2) The morphological changes of cells pretreated with 100 μmol·L−1 H2O2 for 2 h followed by DMEM without FBS for 24h (Model). (C2) The morphology of HSFs pretreated with 100 μmol·L-1 H2O2 for 2 h followed by 86 mg·L-1 VC. (D2–I2) The morphology of HSFs pretreated with 100 μmol·L−1 H2O2 for 2 h followed by GLP1~GLP6 at the concentration of 1.25 g·L−1, respectively. (J2) Cell viability was determined using MTT assay. Changes in morphology were observed by Olympus Fluorescence Inverted Microscope (40×). Results are expressed as the mean ± SD (n = 3). The Student’s t-test was performed to determine statistical significance (***P < 0.001, versus the control group; ###p < 0.001, versus the model group).


