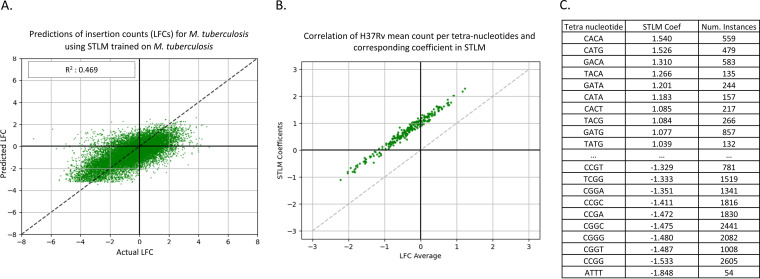
FIG 6.
Predicted LFC versus actual LFC using STLM. Panel A shows a plot of the actual LFCs versus the LFCs predicted by our model. The predictive power of this model is about the same as the neural network (R2 = 0.468), but panel B shows there is a high correlation of mean LFCs of each tetranucleotide and the coefficient in the STLM of the same tetranucleotide, indicating our model represents our data well. Panel C shows the coefficients associated with each tetranucleotide (Table S1), sorted by coefficient value.

