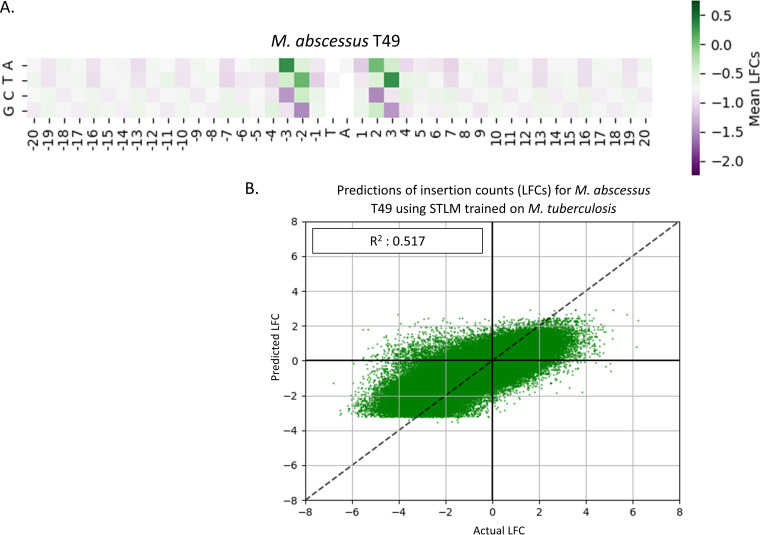
FIG 9.
M. abscessus Taiwan49 clinical isolate data set. The heatmap in panel A is calculated in the same manner that the previous heatmaps were calculated. The pattern of this heatmap looks very similar to the H37Rv heatmap (Fig. 4) as well as the heatmap for the M. abscessus ATCC 19977 reference strain (Fig. 8). The predictive power of the STLM on the M. abscessus T49 data set in panel B shows a high R2 value of 0.517, like that of the M. abscessus reference data set. This indicates that nucleotide biases explain at least half of the variance in insertion counts for this data set with nucleotide biases.

