
FIG 4.
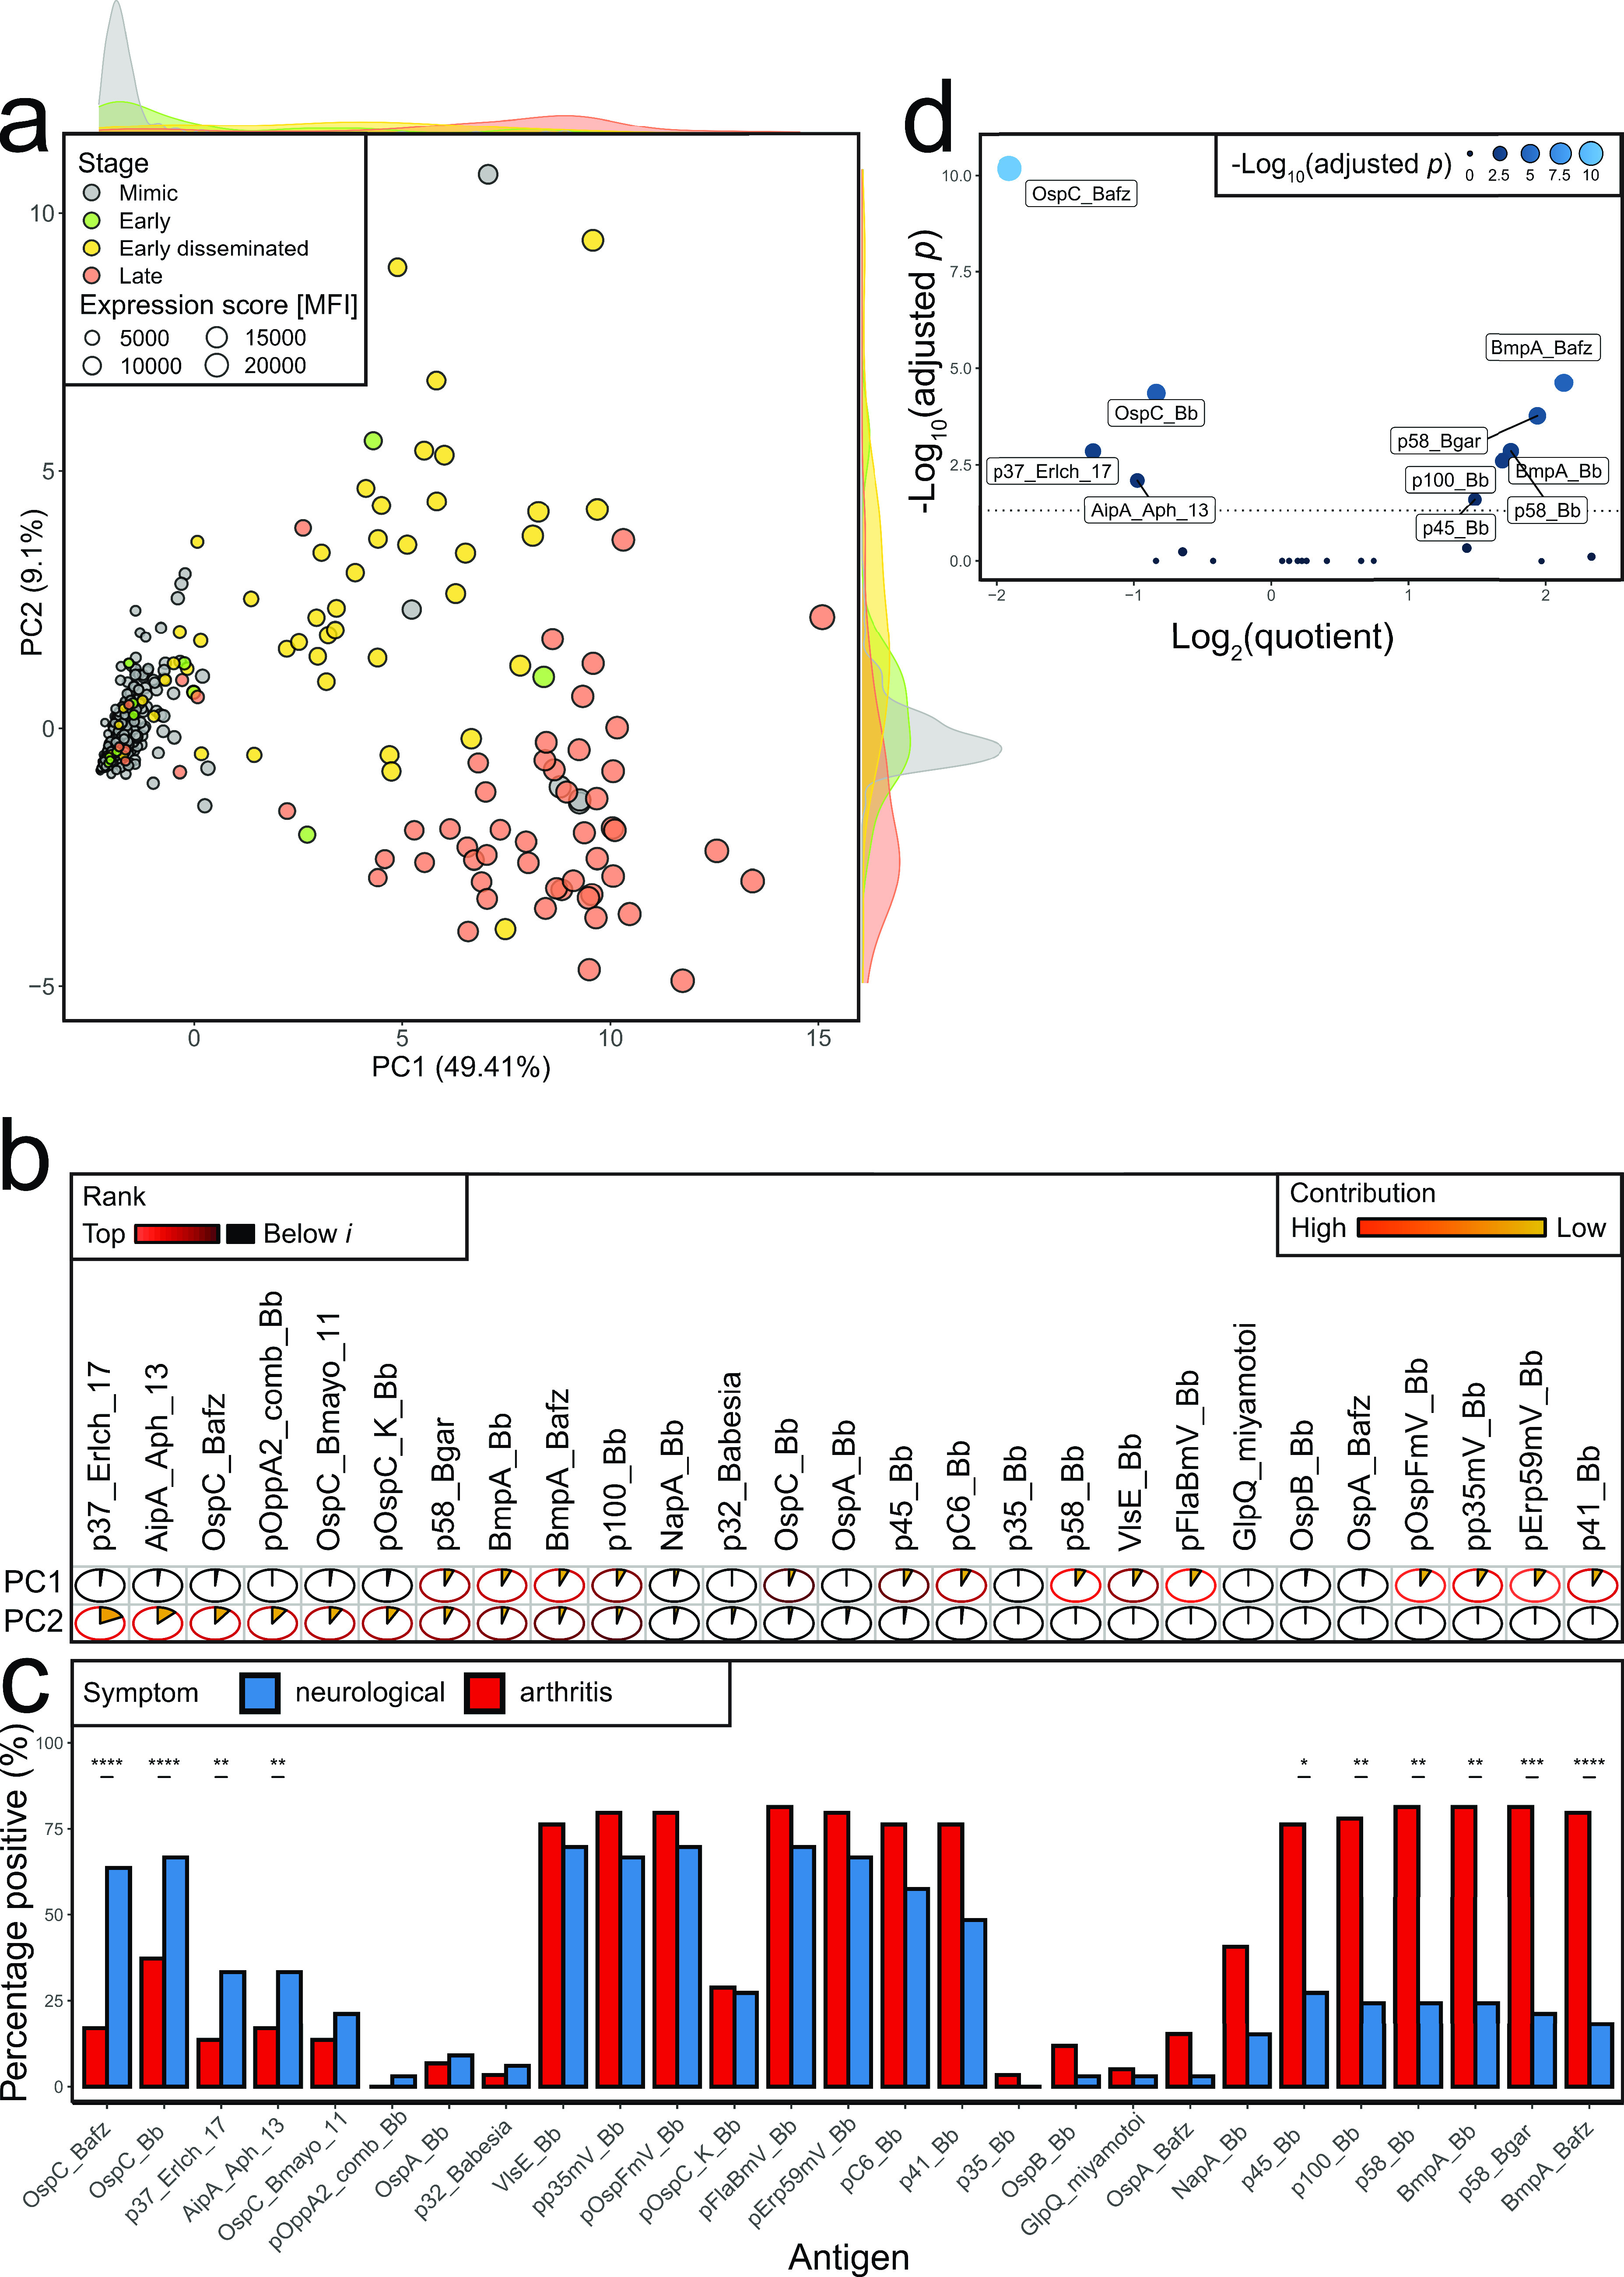
Stage dependency of serological response. Uninformative antigens (Fig. S1) were filtered as stated in Materials and Methods. Asterisks indicate significance. (a) Principal-component analysis of 27-antigen panel in 468 children (354 symptomatic controls, 13 early, 47 early disseminated, and 54 late-stage patients), colored by stage. To avoid overplotting, mimics were plotted first. Expression score was calculated as the mean MFI of the 27-antigen panel per patient. (b) Relative contribution of antigens per principal component. Pie charts and colors indicate the contribution to each individual principal component. Circle outline was colored in shades of red if expression was higher than in a hypothetical uniform variable contribution scenario with expression i (PC1, n = 14; PC2, n = 10), and brightness indicates rank position (Fig. S3c). (c) Antigen positivity was defined as described in Materials and Methods. Shown is the percentage of patients with arthritis (defined by swollen joint) and neurological symptoms (defined by cranial neuritis on exam or meningitis on LP [cerebrospinal fluid white blood cells, ≥10 cells/mm3]). Results were sorted by Holm’ adjusted P value of Fisher’s exact test, first increasing for antigens which were positive in more patients with arthritis than with neurological symptoms. The remaining antigens were sorted by decreasing level. (d) Quotient of patients with arthritis divided by patients with neurological symptoms per antigen versus adjusted P value. Dashed line indicates an adjusted P value of 0.05. Asterisks indicate statistical significance according to the respective P value (*, P ≤ 0.05; **, P ≤ 0.01; ***, P ≤ 0.001; ****, P ≤ 0.0001).