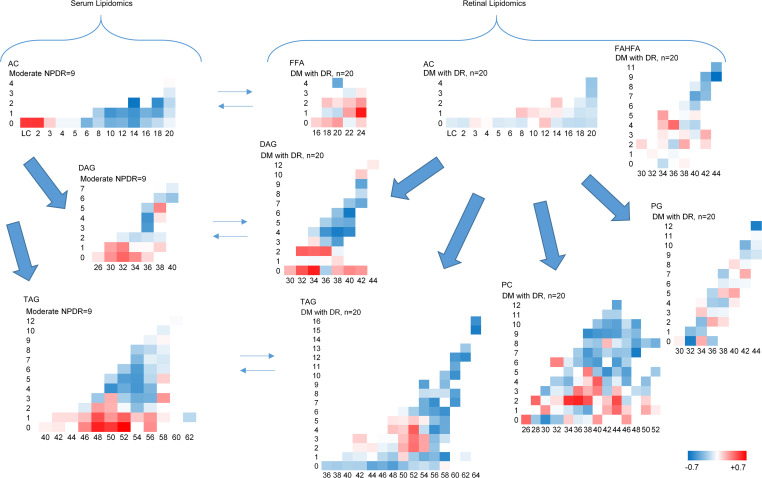
Figure 7. Similar lipid alterations in serum and retinal suggesting parallel changes in the 2 compartments.
Left panel shows the serum lipidomics in moderate nonproliferative diabetic retinopathy (n = 9), and right panel shows central retinal lipidomics in diabetes with retinopathy (n = 20). The x axis in all panels represents carbon number, and the y axis represents the number of double bonds.

