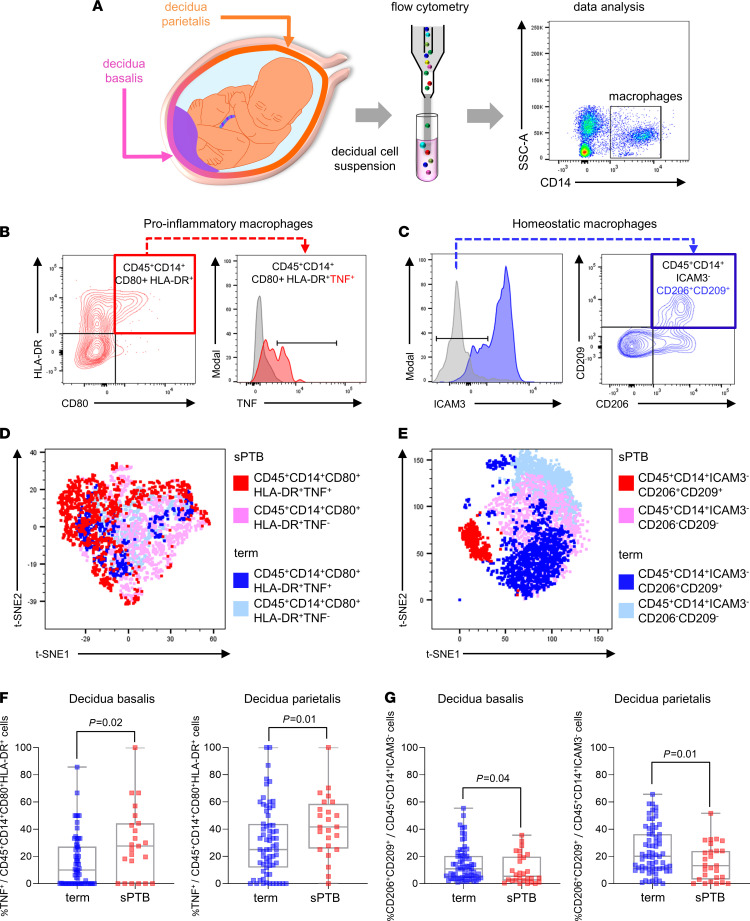
Figure 1. Specific subsets of proinflammatory and homeostatic macrophage subsets are differentially abundant at the materno-fetal interface of women with spontaneous preterm birth compared with term birth.
(A) Schematic representation of the materno-fetal interface, including the uterine decidua basalis and decidua parietalis. Cell suspensions were prepared from the decidual tissues, and macrophage subsets were analyzed by flow cytometry with markers CD14, CD80, HLA-DR, ICAM3, CD206, CD209, CD163, NRP-1, TNF, IL12, iNOS, and IL10, according to the gating strategy in Supplemental Figure 1. (B) Representative FACS plots of CD45+CD14+CD80+HLA-DR+ cells, considered proinflammatory macrophages, expressing TNF. (C) Representative FACS plots of CD45+CD14+ICAM3– cells, considered homeostatic macrophages, expressing CD206+CD209+. (D) Representative t-distributed stochastic neighbor embedding (t-SNE) plot of CD45+CD14+CD80+HLA-DR+ proinflammatory macrophages, color-coded to identify TNF+ cells from women with spontaneous preterm birth (red) and term birth (dark blue), and TNF– cells from women with spontaneous preterm birth (pink) and term birth (light blue). (E) Representative t-SNE plot of CD45+CD14+ICAM– homeostatic macrophages, color-coded to identify CD206+CD209+ cells from women with spontaneous preterm birth (red) and term birth (dark blue), and CD206–CD209– cells from women with spontaneous preterm birth (pink) and term birth (light blue). (F) Frequency of CD45+CD14+CD80+HLA-DR+ cells expressing TNF in the decidua basalis and decidua parietalis of women with term (n = 63–67) or spontaneous preterm (n = 23–24) birth. (G) Frequency of CD45+CD14+ICAM3– cells expressing CD206 and CD209 in the decidua basalis or the decidua parietalis of women with term (n = 66–68) or spontaneous preterm (n = 27–28) birth. Data are presented as mean and SEM. Symbols are values from individual women. Data were analyzed by Mann-Whitney U test. P values were considered significant when P was less than 0.05. Data on other macrophage subpopulations are shown in Supplemental Figure 2. Demographic and clinical characteristics of the study population are shown in Table 1.

