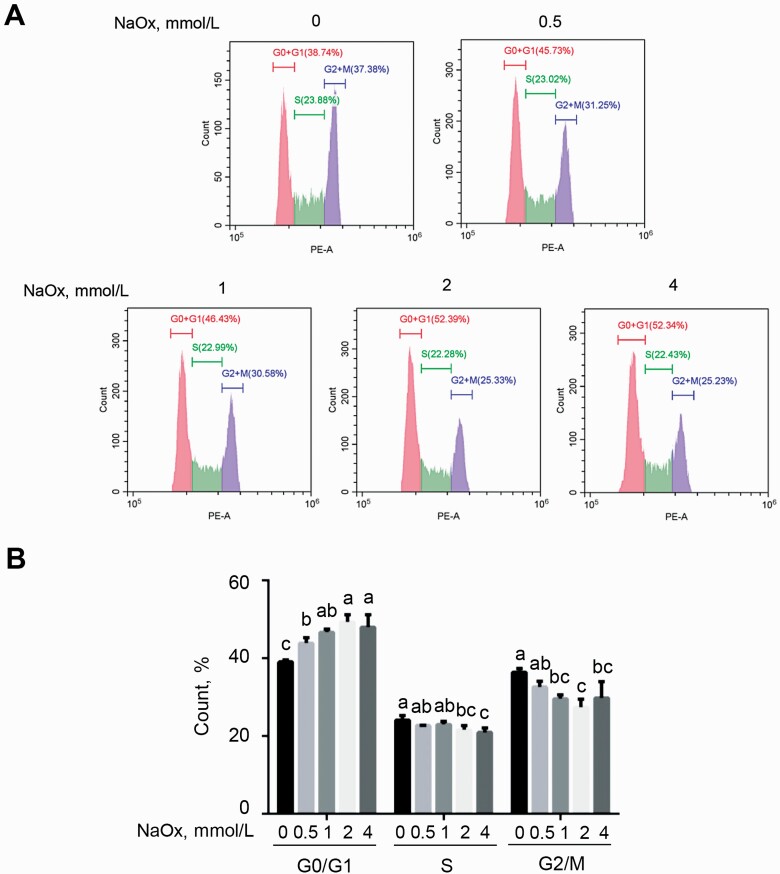
Figure 2.
Cell cycle analysis of MDCK cells exposed to NaOx treatment. (A) MDCK cells were subjected to a 6-h serum starvation and then a 24-h treatment of NaOx, following which cell cycle distribution was measured by flow cytometry. (B) The percentage of MDCK cells in G0/G1, S, and G2/M phases. Data are presented as means ± SEM (n = 3). Bars labeled with different letters mean significant difference (P < 0.05). Abbreviations: MDCK, Mardin–Darby canine kidney; NaOx, sodium oxalate.

