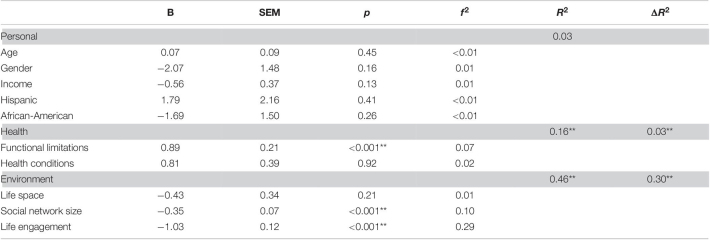
TABLE 7.
Results of hierarchical regression predicting loneliness.
The row in gray represents a set of variables with R2 being the variance explained by all variables in the model at the step and ΔR2 being the change in variance explained by the set of variables added in the step. Parameter estimates are for the step.
B, Unstandardized Beta; SEM, Standard error of measurement; f2, Cohen’s f2 a measure of effect size representing the signal to noise ratio.
*p < 0.05; **p < .01.

