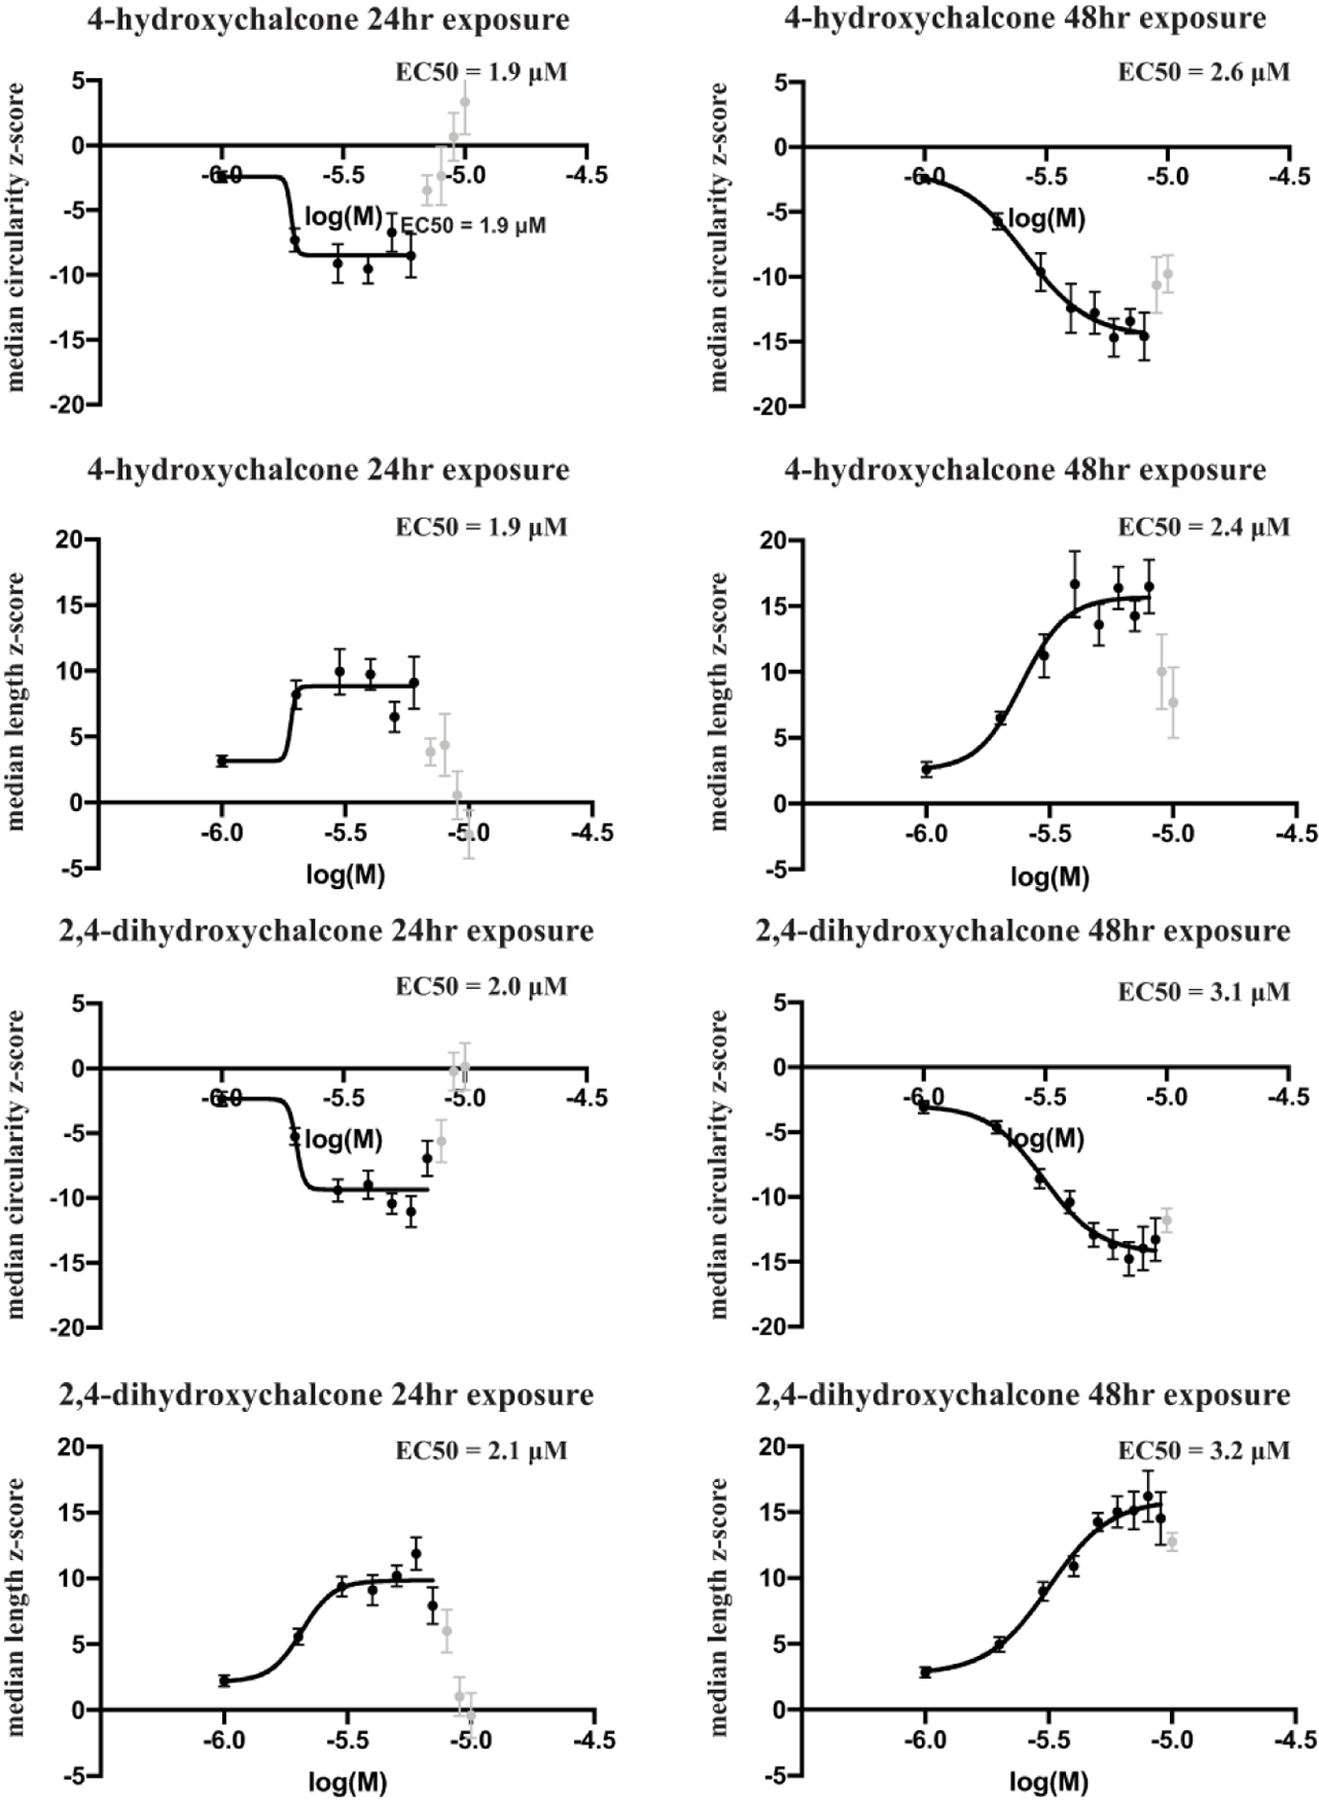
Figure 3.

Dose response curves for mitochondrial median circularity and length using 4-hydroxychalcone and 2,4-dihydroxychalcone. Each compound was assayed over a concentration range from 1 to 10 μM on two duplicate plates. Robust z-scores were calculated for mitochondrial median circularity and length values of the neuritic mitochondria for each well and were plotted against the log10 of the molar concentrations of the compounds. Each point on the plot represents the robust z-score average±SEM of 8 independent wells between the two independent plates. High concentrations of each compound caused toxicity in the wells as illustrated by increased and/or decreased z-scores (light grey points) where appropriate. These values were excluded for calculating the EC50 values.
