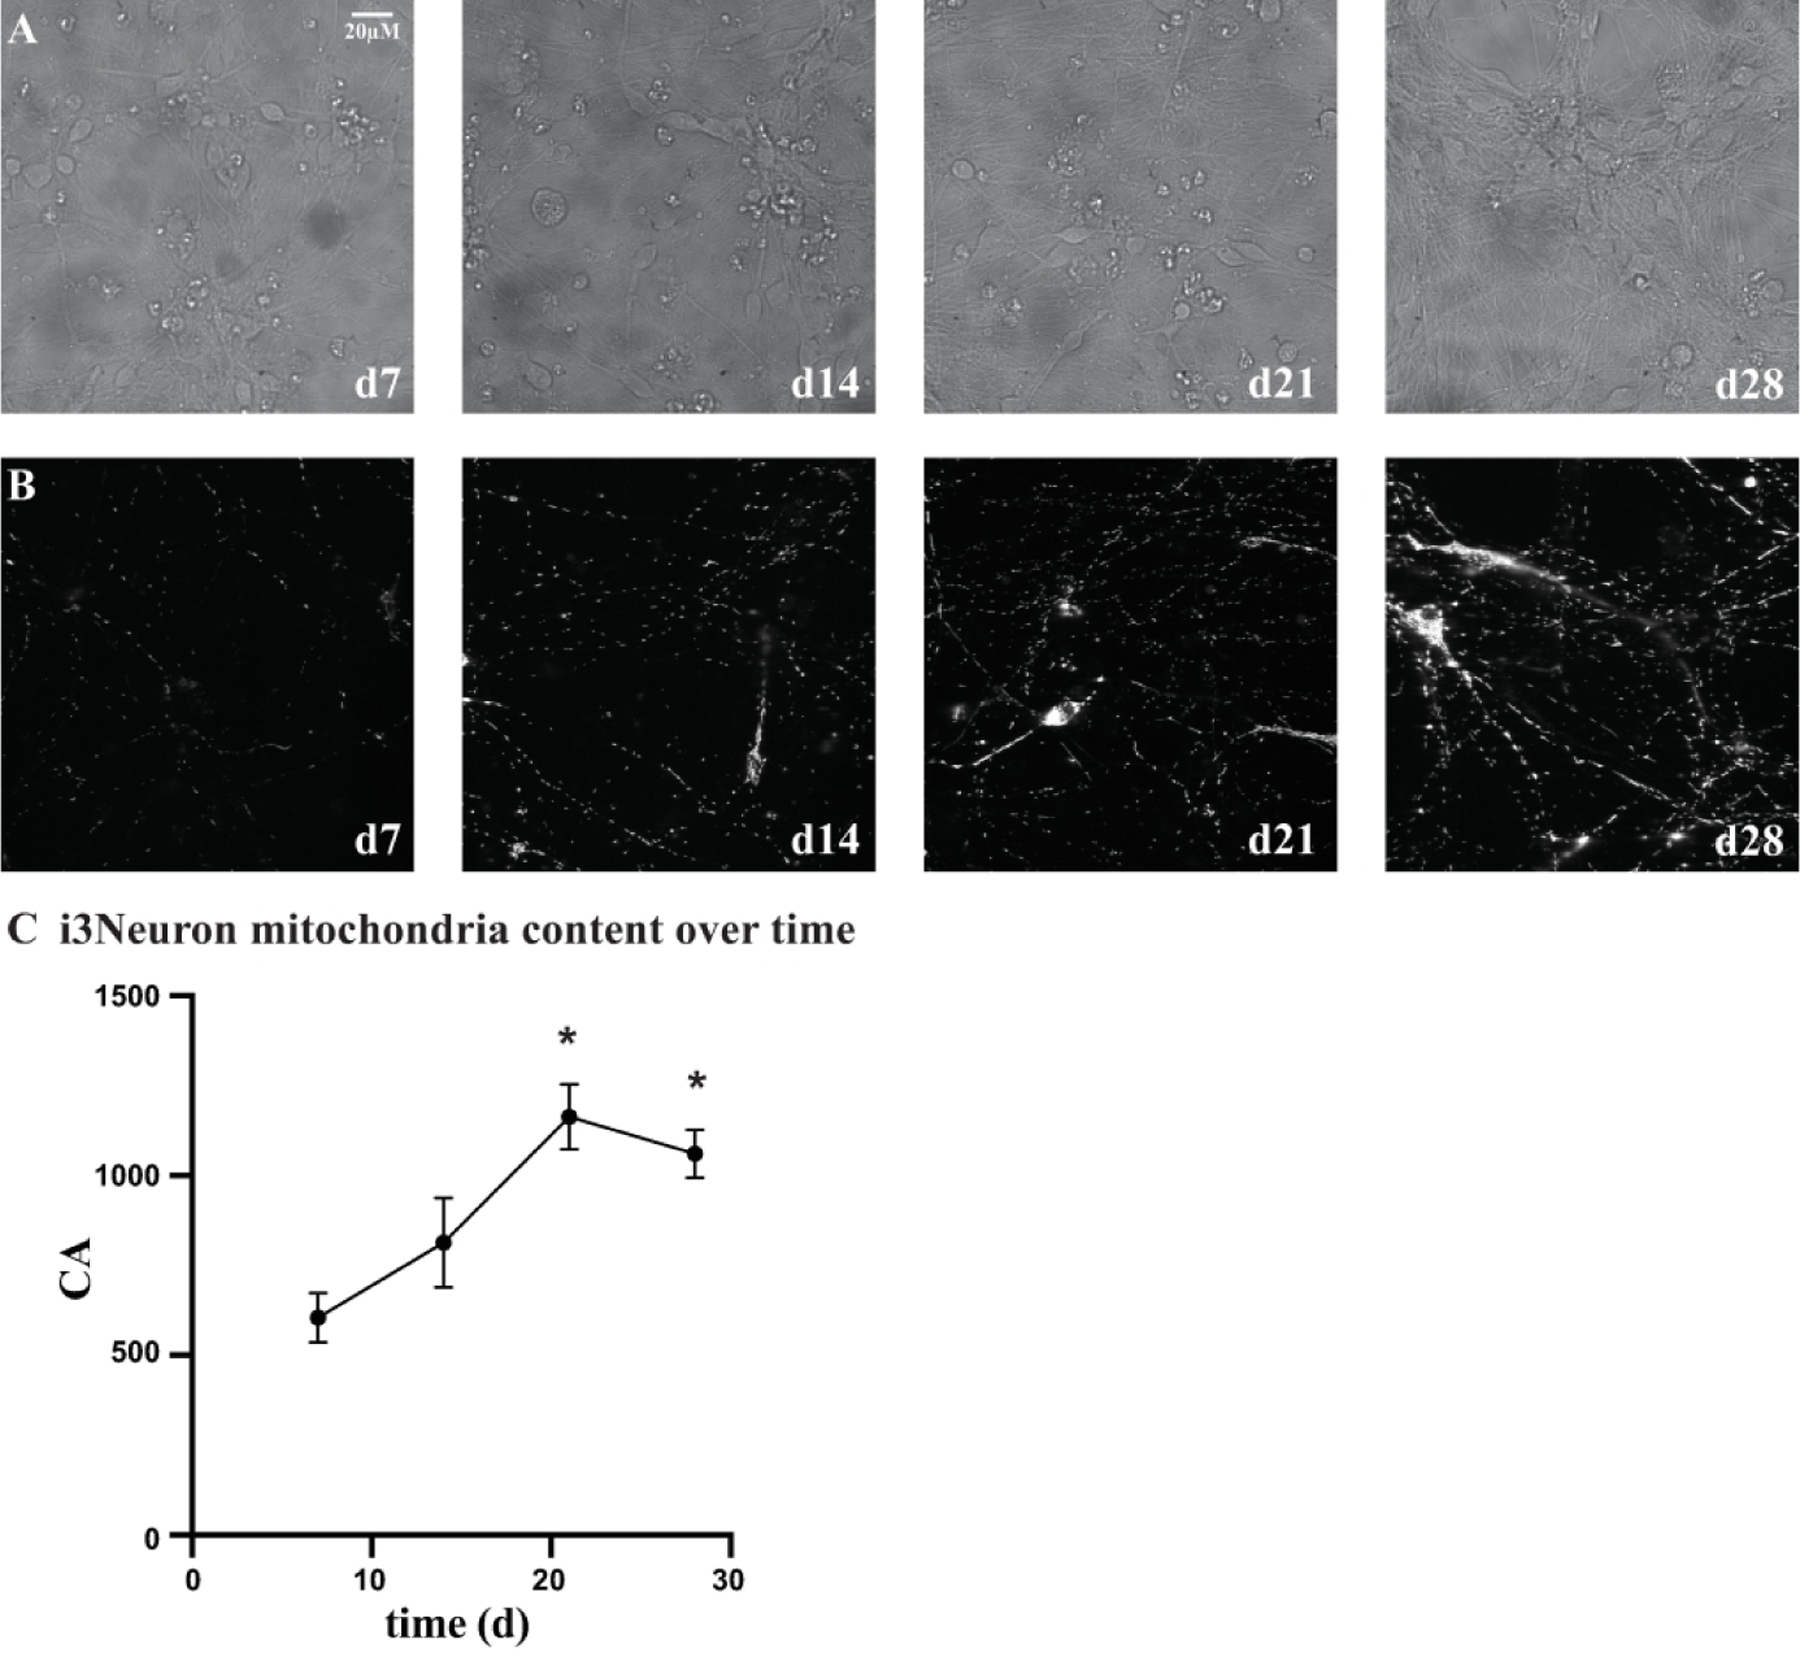
Figure 4.

i3Neuron health and viability extended with astrocyte co-culture. A) 60X brightfield images of i3Neurons transduced with CAG>mtTagGFP2 lentivirus at day 2. i3Neurons were cryopreserved on day 3 and revived to be co-plated with human astrocytes at a 2:1 ratio in each well of a 384 well plate (10,000 i3Neurons/5,000 human astrocytes). B) Corresponding 60X TagGFP2 images of i3Neurons. The number of neuritic processes and mitochondria increased with time in culture. C) Quantification of i3Neuron mitochondrial content over time. The average CA values for i3Neuron mitochondria when co-cultured with astrocytes are plotted over the 4-week time culturing period. While the CA values are not significantly different between cell day 7 and day 14, they significantly increase (asterisk) by cell day 21 and day 28 (ANOVA with Tukey multiple comparison. p value = 0.0004 and p value = 0.0048 for cell day 21 and cell day 28, respectively. compared to cell day 7). Values are the average±SEM of 32 i3Neuron wells cultured in cortical neuron media.
