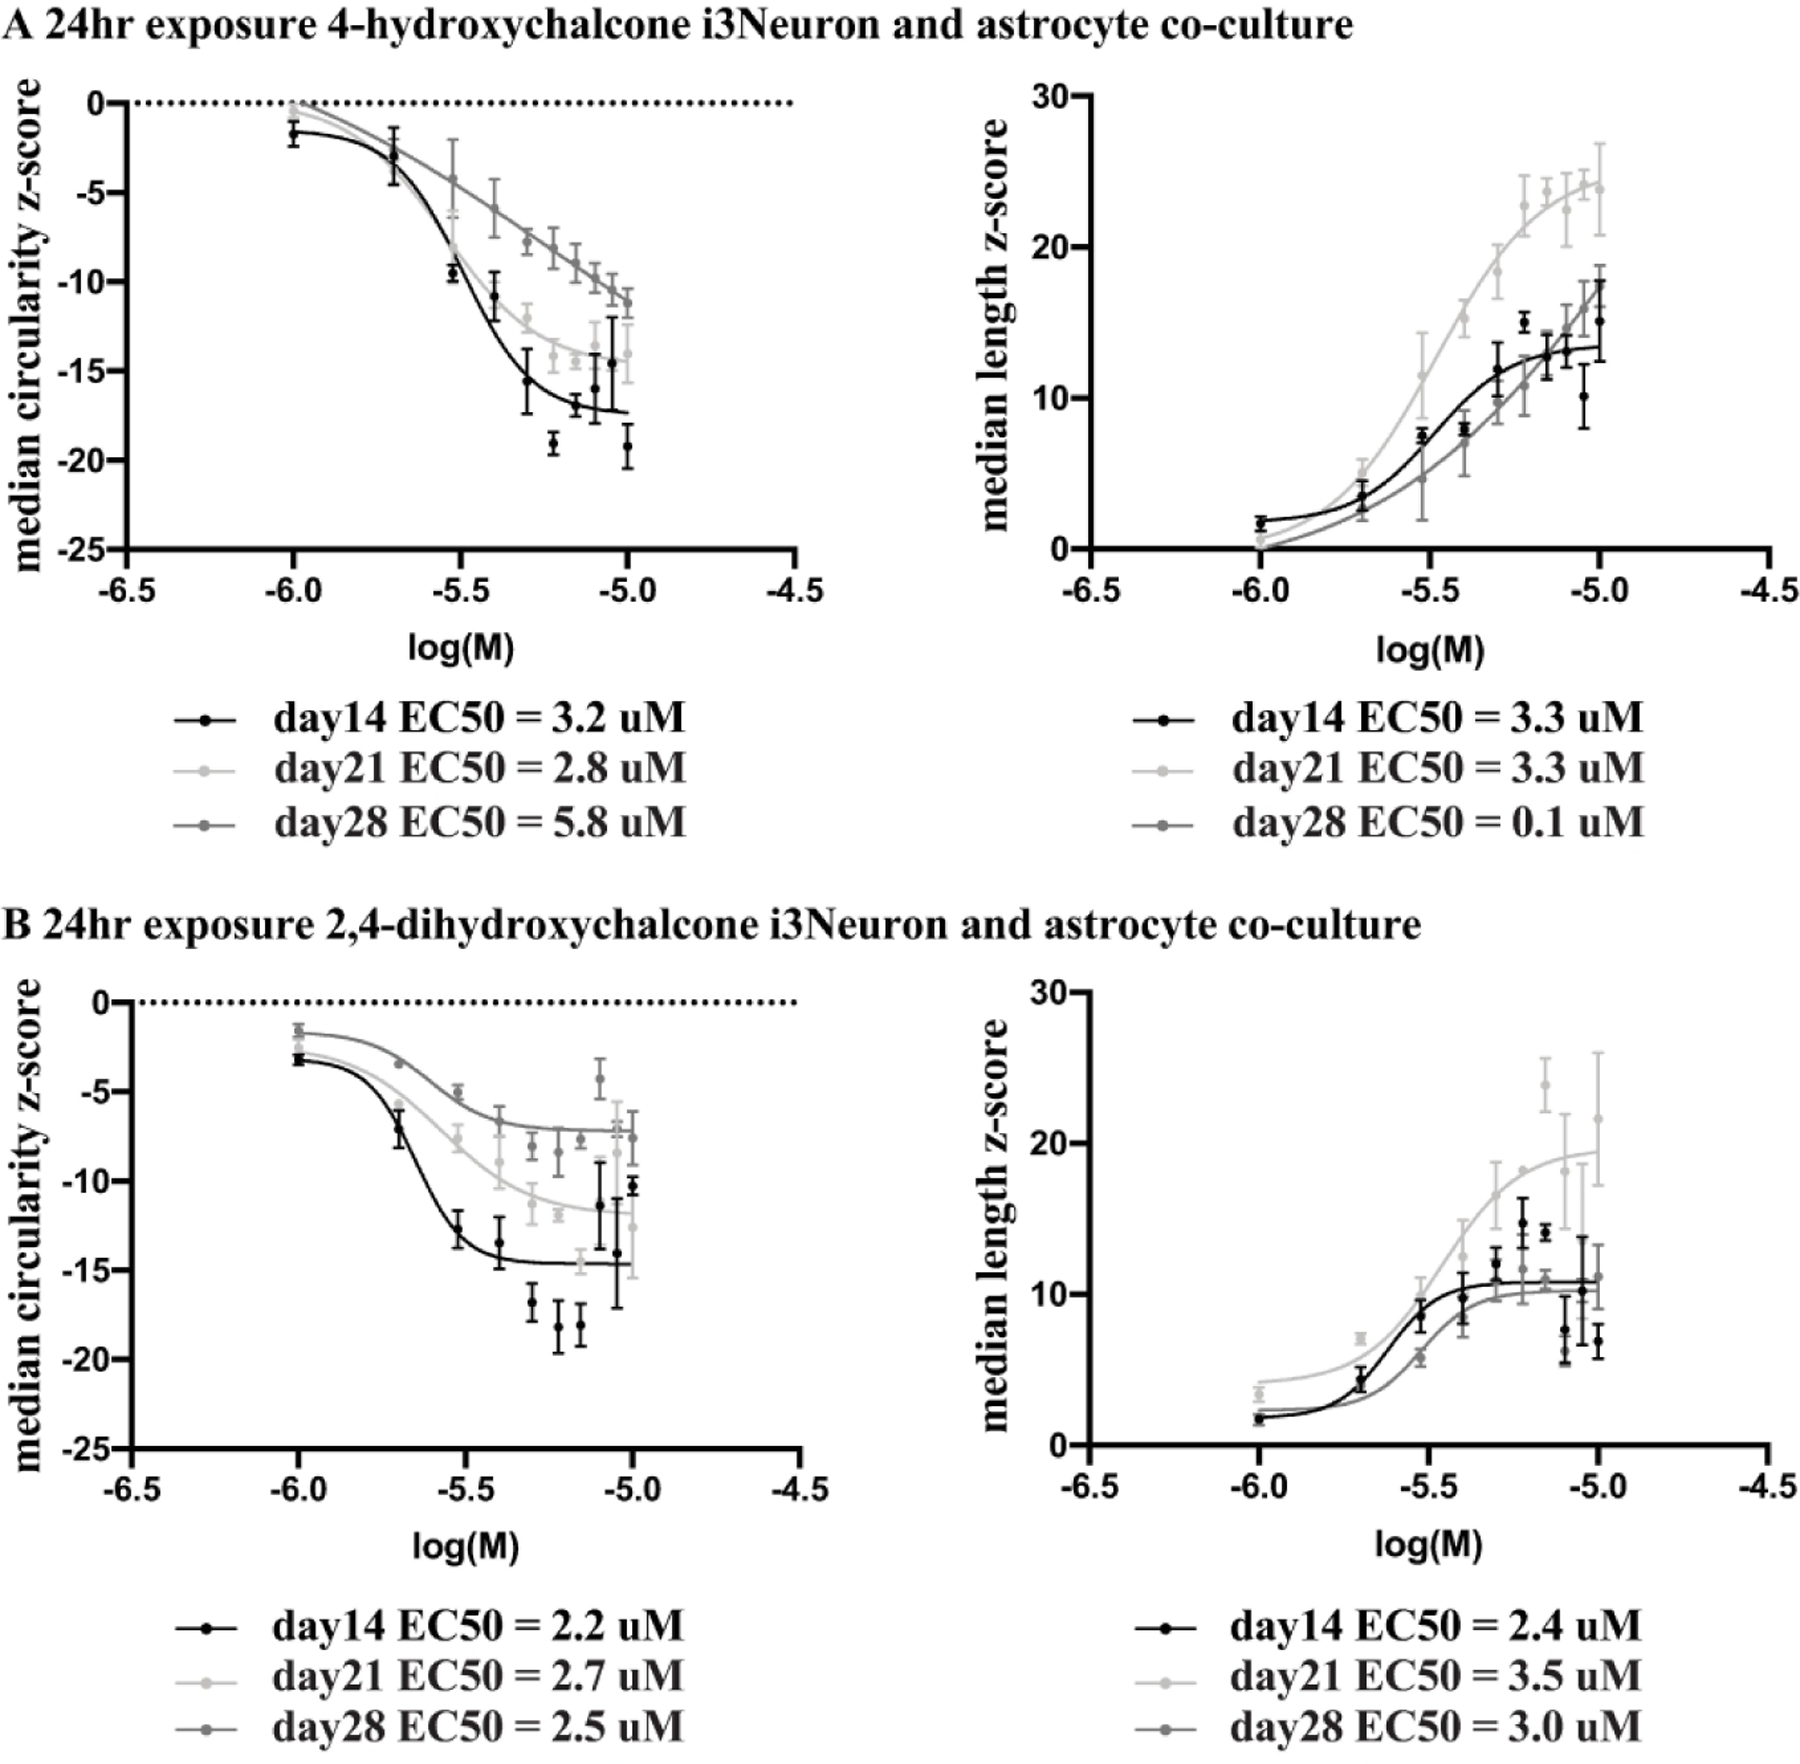
Figure 5.

Dose response curves for i3Neurons co-cultured with human astrocytes over a three-week culture period. A) i3Neurons co-cultured with human astrocytes were exposed to 4-hydroxychalcone for a 24hr period prior to imaging at cell days 14, 21 and 28. Robust z-scores were calculated against DMSO control values at each time point, plotted as dose response curves, and resulting EC50 values are shown beneath each graph for the mitochondrial median circularity and median length parameters. Each point on the plot represents the robust z-score average±SEM of 4 independent wells on the single plate at each weekly time point. The day 14 and day 21 EC50 values remain consistent with the day 14 values having the largest span values for median circularity and the day 21 values having the largest span values for median length. B) i3Neurons co-cultured with human astrocytes were exposed to 2,4-dihydroxychalcone for a 24hr period prior to imaging and dose response curves were graphed as described above. For this compound, the EC50 values at all three time points remained relatively consistent with the day 14 values having the largest span values for mitochondrial median circularity and the day 21 values having the largest span values for median length.
