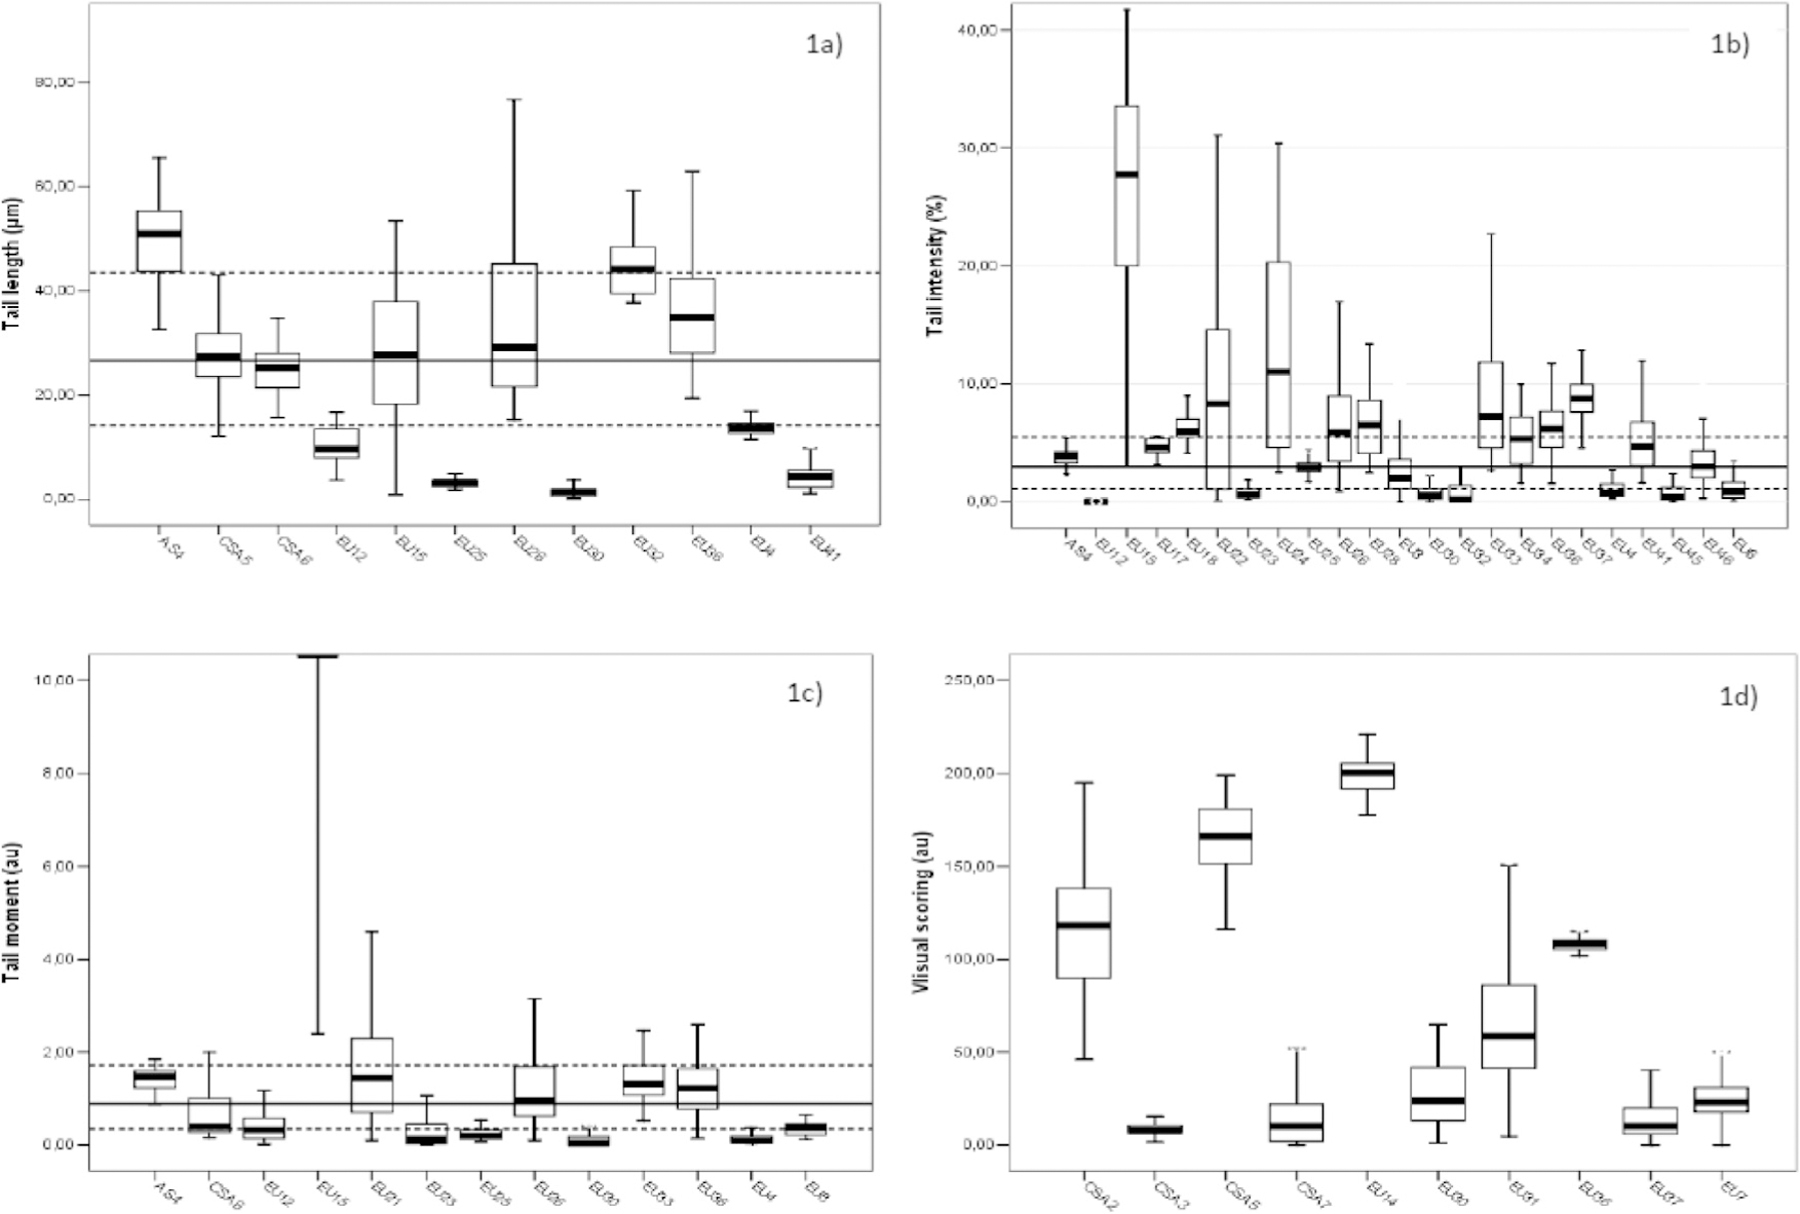
Fig. 2.

Frequency (median and interquartile distance) of DNA damage measured in the whole dataset for all endpoints. 1a) Tail length; 1b) Tail intensity; 1c) Tail moment; 1d) Visual Scoring. Reference lines corresponds to the overall median values for the specific endpoint. Overall median and interquartile interval is reported with whole and dotted lines, respectively in Figure 1a, 1b, and 1c. All statistics shown in this table refers to unexposed cases only.
