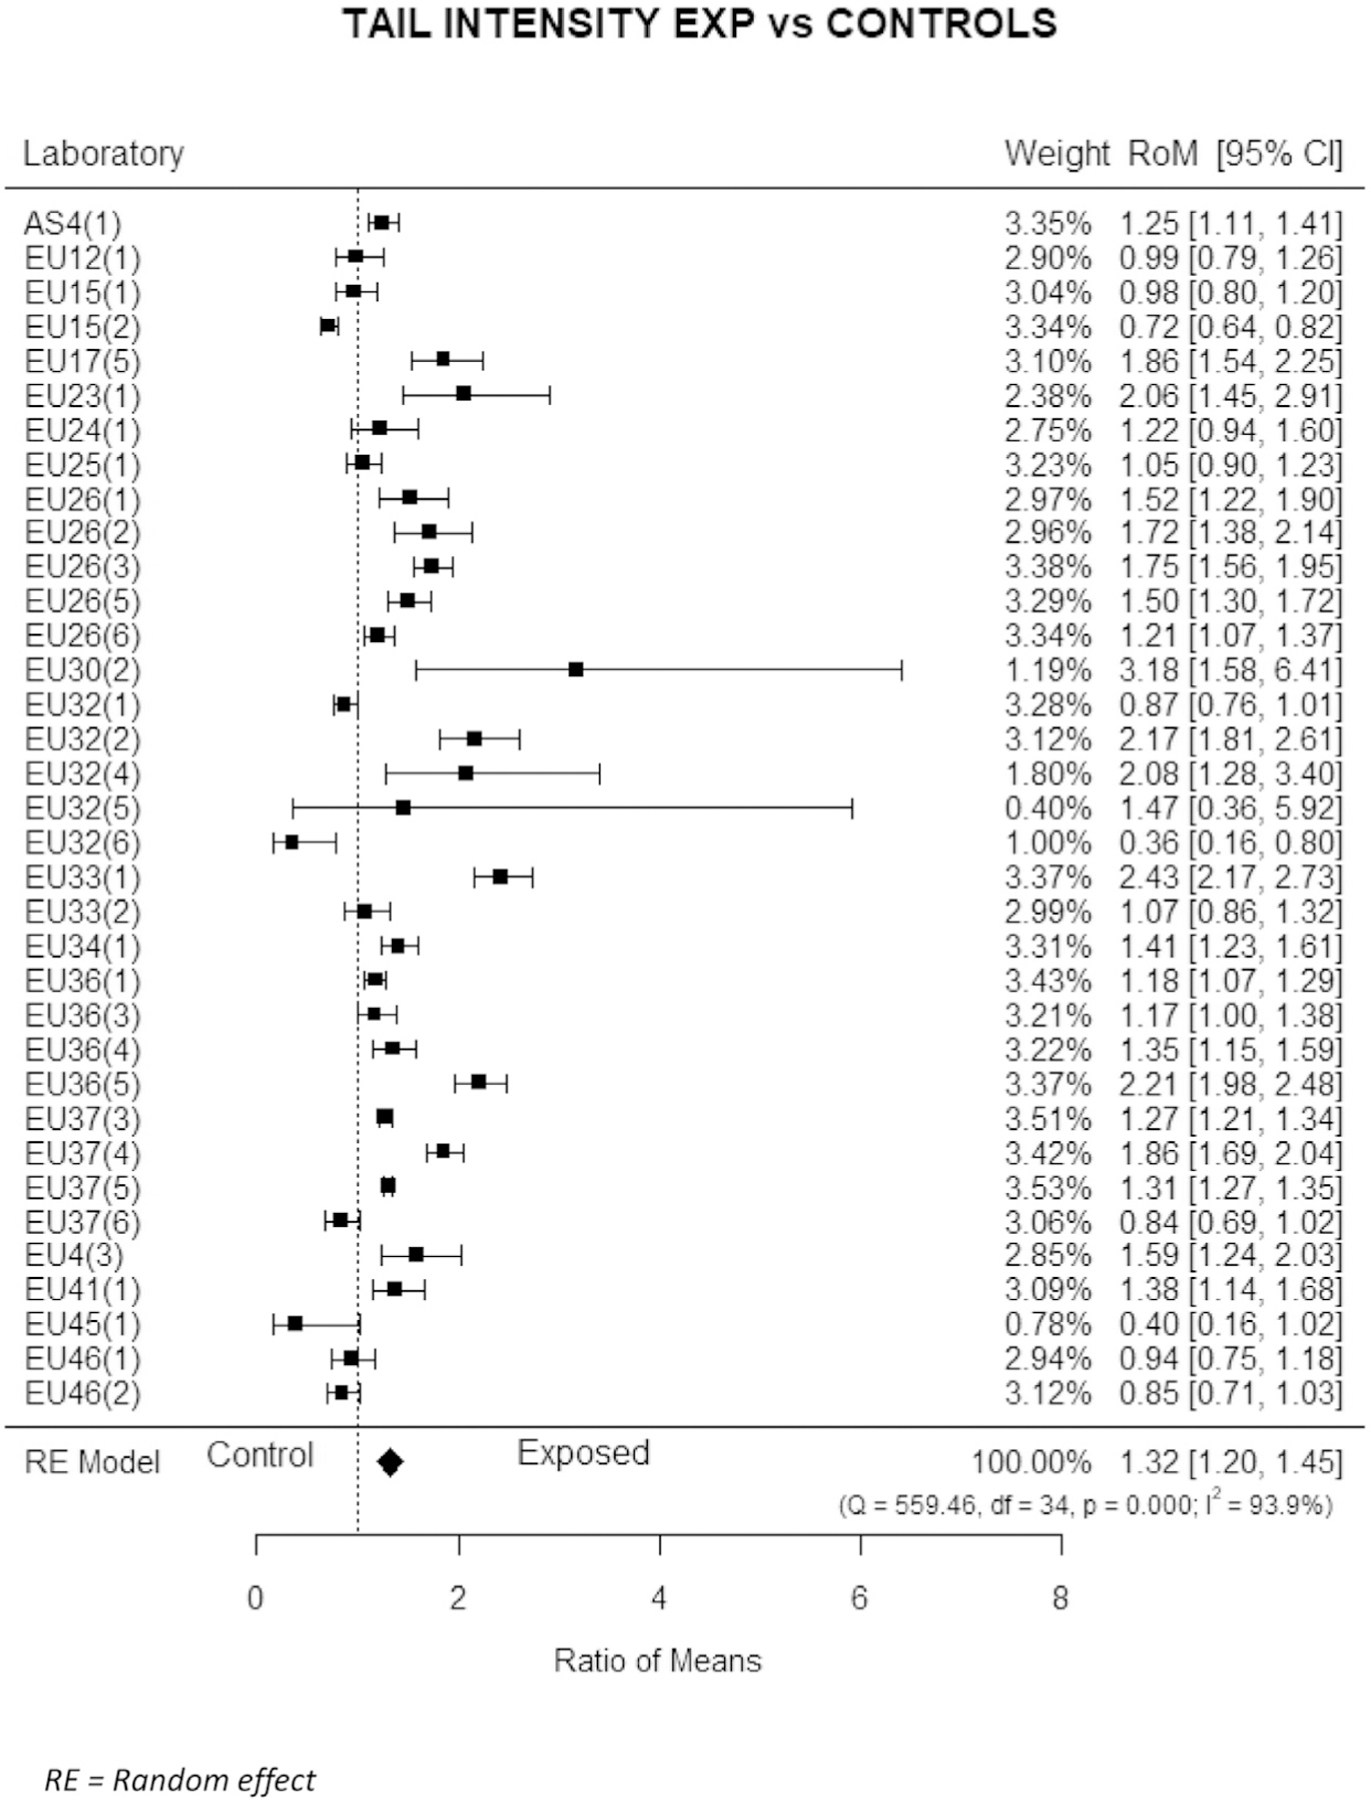
Fig. 4.

Estimated variation of Tail intensity for study groups as compared to unexposed controls. Estimates for individual study and for the whole dataset. Mean ratios (MR), i.e., the ratio of mean DNA values of subjects exposed to the mean values of unexposed controls, with 95 % confidence intervals (95 % CI) are reported for individual studies and for the whole dataset.
