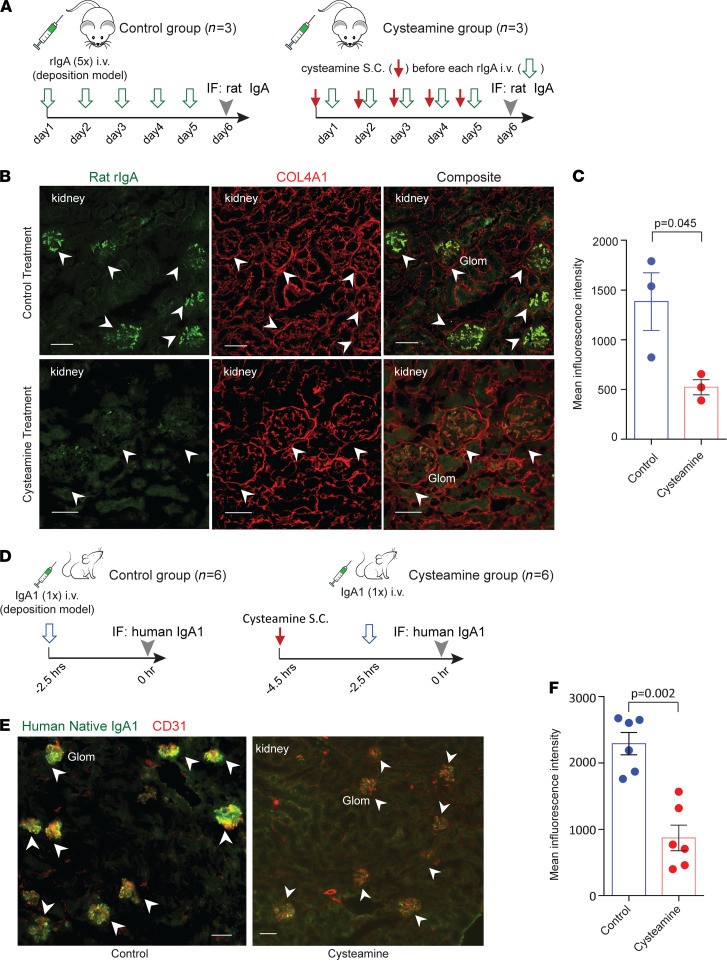
Figure 6. In vivo treatment of rats and mice with cysteamine lowers IgA deposition in the kidney in injection-induced IgAN models.
(A–C) Rat model treated with cysteamine. (A) In a rat IgA deposition model, rats received a daily dose of cysteamine, or buffer control, followed by an injection of recombinant rat rIgA for 5 consecutive days. (B) Representative immunofluorescence images showed prominent rIgA deposition in glomeruli (Glom; arrowheads) in rats treated with buffer (n = 3), in contrast to weaker deposits in cysteamine-treated rats (n = 3). Additional kidney images are provided in Supplemental Figure 4A. (C) Quantitation of deposit in glomeruli between control and cysteamine treatment groups compared by t test (mean ± SEM, 1384 ± 290 MFI vs. 523 ± 76 MFI, n = 3 in each group). Significance between the 2 groups was determined by 2-tailed t test. (D) Mouse model of IgA deposition from injection of human IgA1 purified from human plasma. Each mouse was injected with a single dose of purified human IgA1 2 hours after pretreatment with either cysteamine or buffer control. (E) The buffer control mouse group (n = 6) had prominent IgA1 deposition in glomeruli (arrowheads). In contrast, pretreatment of the mice with cysteamine (n = 6) greatly reduced IgA1 deposition. Additional immunofluorescence images are shown in Supplemental Figure 4B. (F) Quantification of glomerular IgA1 intensity between buffer and cysteamine treatment groups (mean ± SEM, 2293 ± 163 MFI vs. 870 ± 193 MFI, n = 6 in each group). Significance between the 2 groups was determined by 2-tailed t test. Scale bar: 50 μm.

