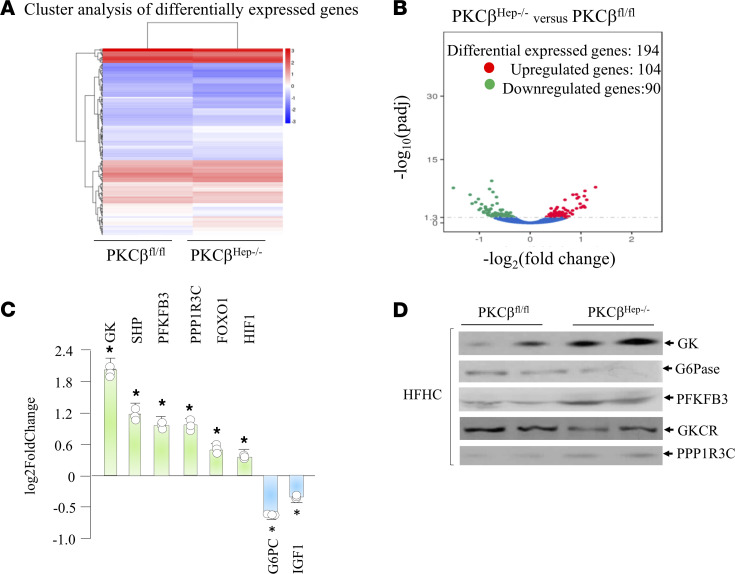
Figure 3. Hepatic PKCβ deficiency alters expression of genes promoting glycogenesis and gluconeogenesis.
RNA-Seq analysis of liver mRNA from PKCβfl/fl and PKCβHep–/– mice fed high-fat diet (HFD) for 12 weeks. (A) Hierarchical clustering heatmap of differentially expressed genes in the liver of PKCβfl/fl and PKCβHep–/– mice fed HFD for 16 weeks. Red represents high expression genes; blue represents low expression genes. Color descending from red to blue indicates log10(FPKM + 1) from large to small. (B) KEGG enrichment histogram analysis. (C) Genes related to glycogen metabolism are differentially expressed in liver of the above mice. (D) Western blotting of liver extracts from above mice for GK, G6Pase, PFKFB3, and GKCR proteins. The results are mean ± SEM. *P < 0.05 indicates the difference between control and KO livers. (n = 3) by 2-way ANOVA followed by Bonferroni’s multiple-comparison test (C).

