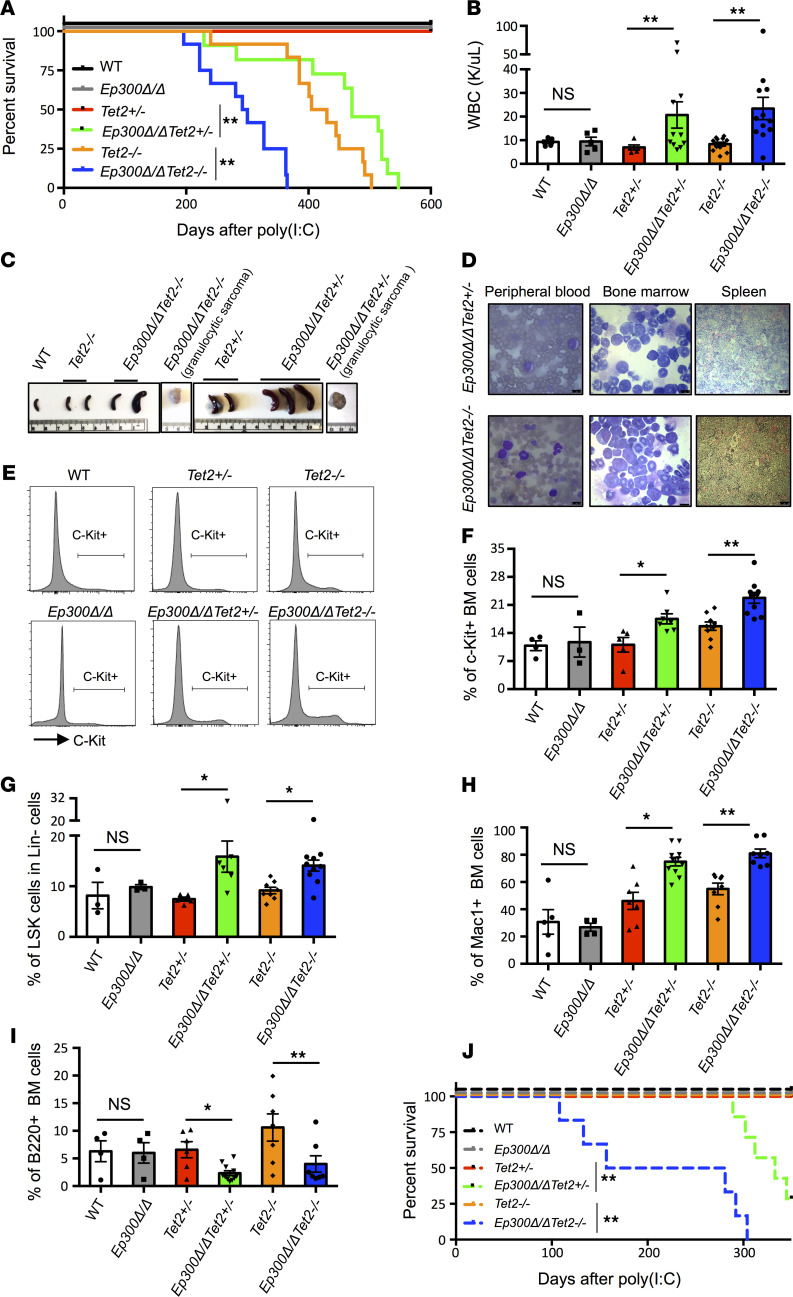
Figure 1. Loss of p300 in Tet2-deficient mice accelerates the onset of leukemia and shortens survival.
(A) Kaplan-Meier survival curve of mice after poly(I:C) injections for each genotype (WT, Ep300Δ/Δ, Tet2+/–, Ep300Δ/ΔTet2+/–, Tet2–/–, and Ep300Δ/ΔTet2–/–). Loss of p300 in Tet2-deficient mice shortens the survival time. (B) WBC counts in peripheral blood of endpoint Ep300Δ/ΔTet2+/– and Ep300Δ/ΔTet2–/– mice and age-matched Tet2+/– and Tet2–/– mice. The WT, Ep300Δ/Δ, and Tet2–/– mice were age-matched to Ep300Δ/ΔTet2–/– mice and Tet2+/– mice were age-matched to Ep300Δ/ΔTet2+/– mice. (C) Splenomegaly and granulocytic sarcoma found in Ep300Δ/ΔTet2+/– and Ep300Δ/ΔTet2–/– mice at endpoint, compared with age-matched WT, Tet2–/–, and Tet2+/– mice. (D) Morphology of peripheral blood and bone marrow cells and histology of spleen from moribund Ep300Δ/ΔTet2+/– and Ep300Δ/ΔTet2–/– mice. Scale bar for peripheral blood and bone marrow cells is 10 μm and for spleen is 50 μm. (E and F) Representative flow cytometry profiles (E) and percentage of c-Kit+ cells in the bone marrow (F) of moribund Ep300Δ/ΔTet2+/– and Ep300Δ/ΔTet2–/– mice and age-matched Tet2+/– and Tet2–/– mice. (G) Percentage of LSK cells in the Lin– bone marrow cells of moribund Ep300Δ/ΔTet2+/– and Ep300Δ/ΔTet2–/– mice and age-matched Tet2+/– and Tet2–/– mice. (H) Percentage of Mac-1+ cells in the bone marrow of moribund Ep300Δ/ΔTet2+/– and Ep300Δ/ΔTet2–/– mice and age-matched Tet2+/– and Tet2–/– mice. (I) Percentage of B220+ cells in the bone marrow of moribund Ep300Δ/ΔTet2+/– and Ep300Δ/ΔTet2–/– mice and age-matched Tet2+/– and Tet2–/– mice. (J) Kaplan-Meier survival curve after poly(I:C) injections for each genotype (WT, Ep300Δ/Δ, Tet2+/–, Ep300Δ/ΔTet2+/–, Tet2–/–, and Ep300Δ/ΔTet2–/–) in transplantation models. P values were determined using a 2-tailed Student’s t test for samples of unequal variance. LSK, lineage– Sca1+c-Kit+.

