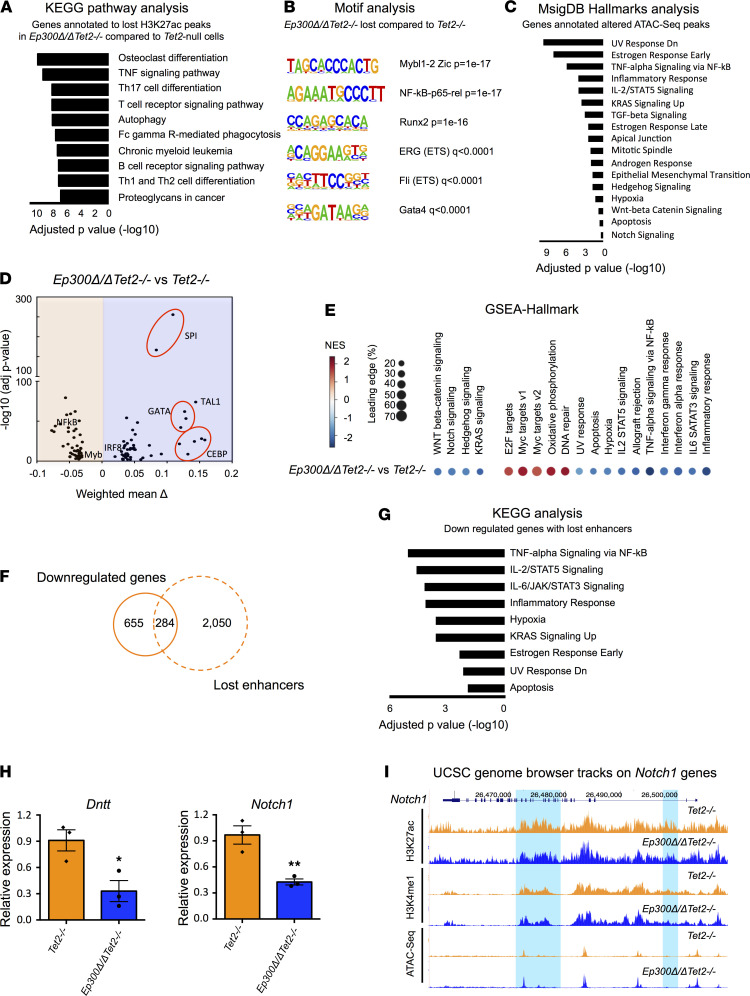
Figure 3. Loss of p300 rewires the epigenetic landscape and reprograms the transcriptome of Tet2-null HSPCs.
(A) KEGG pathway enrichment analysis of the genes annotated to the H3K27Ac peaks lost in Ep300Δ/ΔTet2–/– Lin– cells compared with Tet2–/– Lin– cells. (B) HOMER motif analysis of enhancers that lost in Ep300Δ/ΔTet2–/– Lin– cells compared with Tet2–/– Lin– cells. (C) Enrichr-Hallmarks analysis of the genes annotated to the altered ATAC-Seq peaks in Ep300Δ/ΔTet2–/– LSK cells compared with Tet2–/– LSK cells. (D) Volcano plot showing the differential transcription factor binding obtained from diffTF analysis of ATAC-Seq data in Ep300Δ/ΔTet2–/– HSPCs compared with Tet2–/– HSPCs. Transcription factors that pass the significance threshold (adjusted P value < 0.01 and weighted mean difference greater that 0.03) are shown. (E) GSEA Hallmarks analysis of DE genes between Ep300Δ/ΔTet2–/– and Tet2–/– HSPCs. (F) Overlap of the downregulated genes and the genes annotated to lost enhancers in Ep300Δ/ΔTet2–/– cells compared with Tet2–/– cells. (G) Enrichr-KEGG analysis of the 284 genes identified in F. (H) Quantitative RT-PCR assays showing the expression of Dntt and Notch1 in HSPCs from Ep300Δ/ΔTet2–/– and Tet2–/– mice. (I) The UCSC genome browser tracks showing the ChIP-Seq and ATAC-Seq signal at Notch1 gene locus. Highlighted in blue are 2 intronic enhancers of Notch1. Both tracks for each mark are adjusted to the same scale. P values were determined using 2-tailed Student’s t tests. HSPCs, hematopoietic stem and progenitor cells; LSK, lineage– Sca1+c-Kit+; GSEA, Gene Set Enrichment Analysis; DE, differentially expressed.

