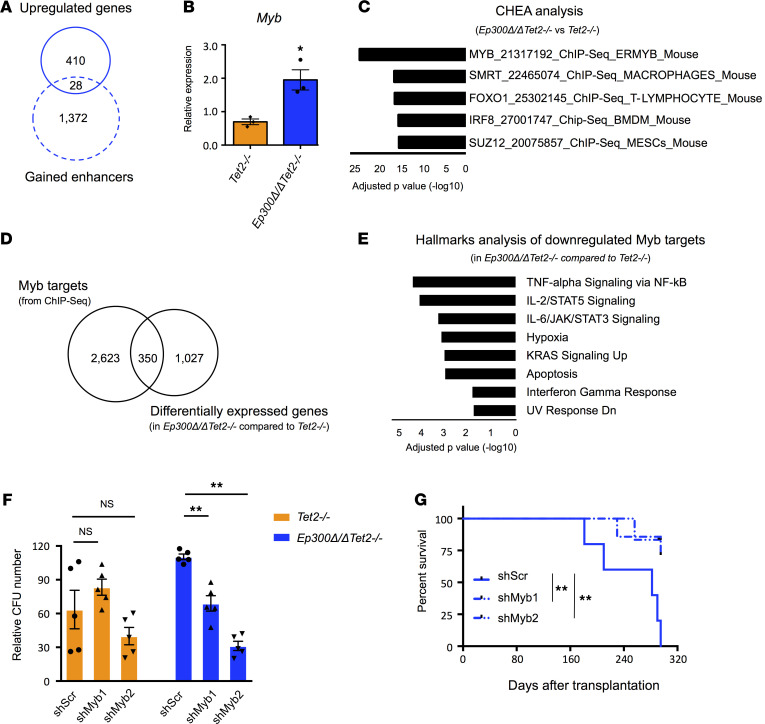
Figure 4. Enhanced proliferation and leukemogenicity of Tet2-null HSPCs after p300 loss are associated with increased Myb expression.
(A) Overlap of the upregulated genes and the genes annotated to gained enhancers in Ep300Δ/ΔTet2–/– cells compared with Tet2–/– cells. (B) Quantitative RT-PCR analysis of the expression levels of Myb in independent biological replicates of HSPCs from Ep300Δ/ΔTet2–/– and Tet2–/– mice. (C) ChEA of the DE genes in Ep300Δ/ΔTet2–/– HSPCs compared with Tet2-null HSPCs. (D) Overlap of the DE genes in Ep300Δ/ΔTet2–/– HSPCs compared with Tet2-null HSPCs and Myb targets identified by ChIP-Seq. A total of 2974 Myb targets were identified from the ChIP-Seq data, and 350 of them were also DE genes. (E) Enrichr-Hallmarks analysis of the 303 downregulated genes identified as Myb targets. (F) Number of colonies obtained after 1 week of culture of 10,000 plated HSPCs from Ep300Δ/ΔTet2–/– and Tet2–/– mice after Myb knockdown (Myb-KD) and cultured in methocult M3434 for 1 week. (G) Kaplan-Meier survival curves of mice receiving Myb-KD-leukemia cells from Ep300Δ/ΔTet2–/– mice. P values were determined using a 2-tailed Student’s t test for B and a 2-way ANOVA test for F. HSPCs, hematopoietic stem and progenitor cells; ChEA, ChIP-X Enrichment analysis; DE, differentially expressed.

