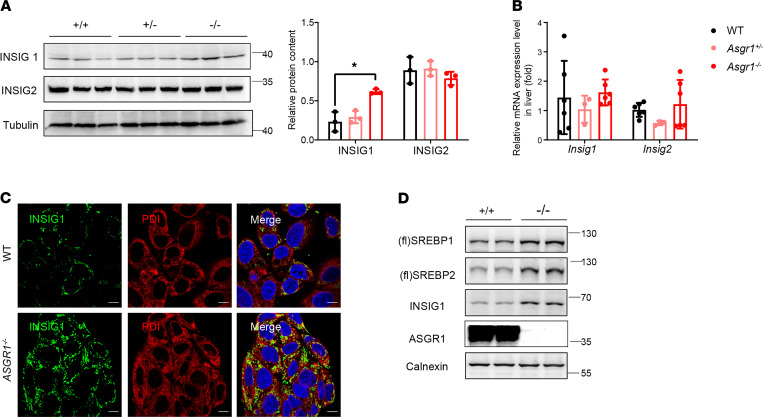
Figure 6. High INSIG1 level is responsible for the ER retention of SREBPs in ASGR1 deficiency.
In mice, (A) INSIG1 and INSIG2 protein contents were analyzed by Western blots in liver tissues, n = 3. (B) mRNA expression level of Insig1 and Insig2 in liver tissues (WT, n = 6; Asgr1+/–, n = 3; Asgr1–/–, n = 6). In HepG2 cells, (C) representative images of immunofluorescence staining for INSIG1 and ER marker PDI (scale bar: 10 μm). (D) SREBP and INSIG1 protein contents of ER fraction isolated from HepG2 cells were analyzed by Western blots. Representative images of the immunoblotting shown, n = 3. All data are shown as the means ± SD. *P < 0.05, as compared with the indicated WT by 1-way ANOVA among 3 groups. Statistical significance between 2 groups was assessed with an unpaired, 2-tailed t test.

