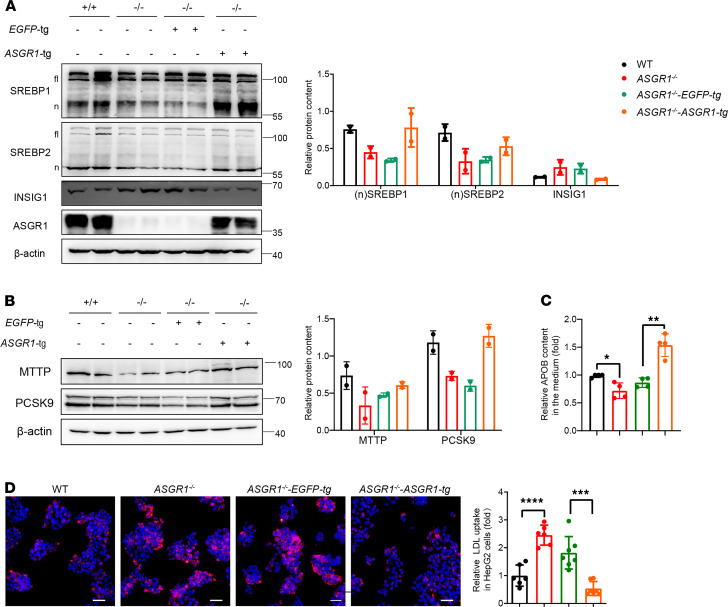
Figure 8. Restoring ASGR1 expression rescues INSIG1-mediated network defects.
ASGR1 overexpression assays were conducted in ASGR1–/– HepG2 cell ASGR1 overexpression (ASGR1–/–-ASGR1-tg) cells and control group with EGFP overexpression (ASGR1–/–-EGFP-tg) were generated for following assays. (A) SREBP and INSIG1 protein content analysis by Western blots. Representative images of the immunoblotting and gray intensity of each band relative to β-actin shown, n = 3. (B) MTTP and PCSK9 were analyzed by Western blots. Representative images of the immunoblotting and gray intensity of each band relative to β-actin was shown, n = 3. (C) Secreted APOB measurement by ELISA, n = 4. (D) The LDL uptake assays. Representative images of LDL-dil accumulation (scale bar: 20 μm) and fluorescence intensity quantitative analysis shown, n = 3. All data are shown as the means ± SD. *P < 0.05, **P < 0.01, ***P < 0.001, ****P < 0.0001 as compared with the indicated WT by unpaired, 2-tailed t test between 2 groups.

