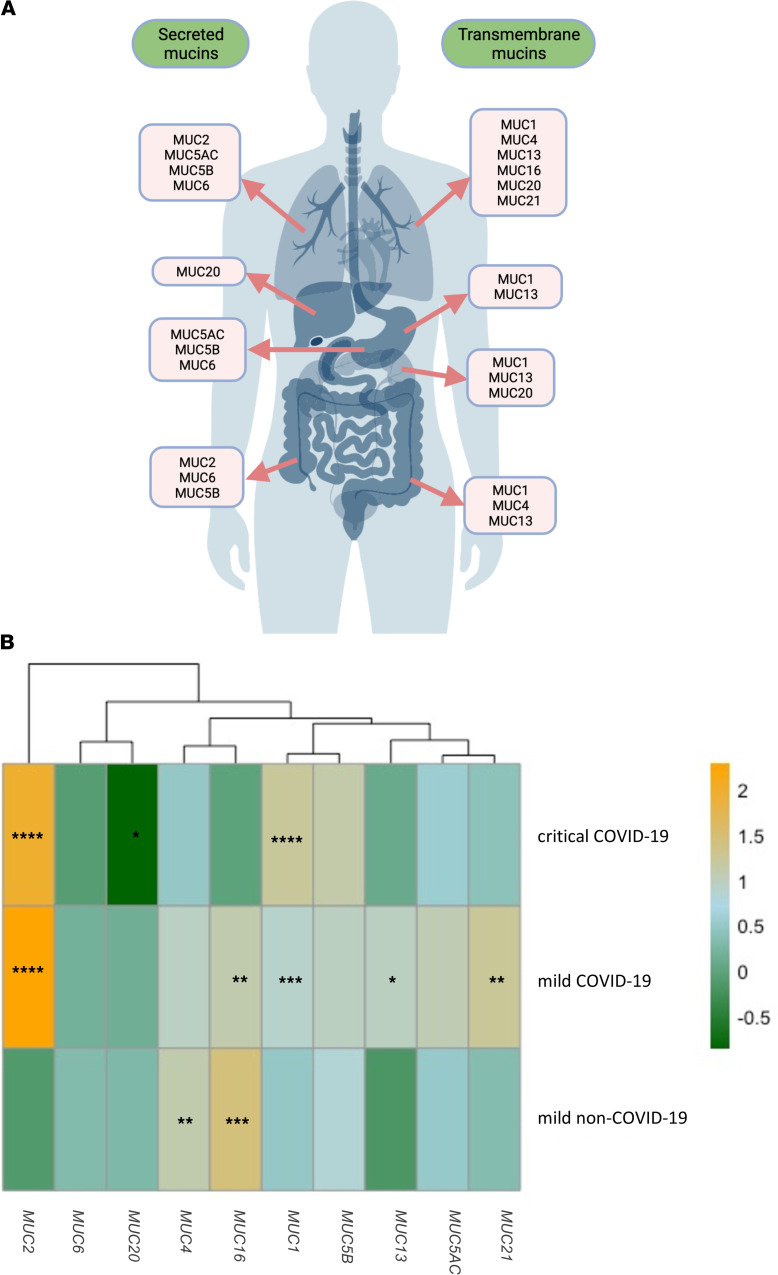
Figure 2. Distribution of secreted and transmembrane mucins at the respiratory (trachea and lungs), gastrointestinal (stomach, intestines, and liver), and urogenital tracts (kidneys) and the peripheral transcriptional mucin signature in critically ill COVID-19, mild COVID-19, and mild non–COVID-19 patients.
(A) Schematic representation of the transmembrane and secreted mucins analyzed in this study and known to be expressed at the mucosal surfaces of the human body (i.e., the respiratory, gastrointestinal, and urogenital tracts) (6). (B) Heatmap showing the log2 fold-change mucin expression data in the different patient cohorts, i.e., critical COVID-19 (n = 50), mild COVID-19 (n = 35), mild non–COVID-19 (n = 30) normalized to the mucin expression data in healthy controls and clustered by expression. Significant differences between critically ill COVID-19, mild COVID-19, and non–COVID-19 patients and healthy controls are indicated by *P < 0.05; **P < 0.01, ***P < 0.001, ****P < 0.0001. One-way ANOVA, Tukey’s post hoc multiple-comparison test.

