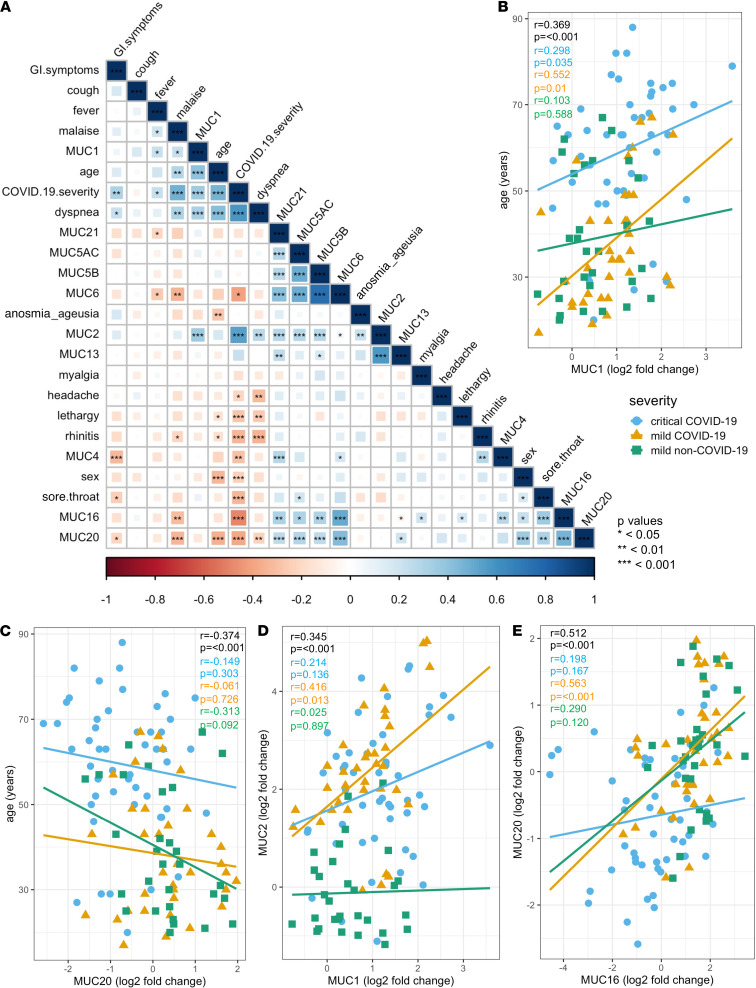
Figure 6. Associations of peripheral mucin mRNA expression with disease severity, age, sex, and symptoms.
(A) Correlogram of the critically ill COVID-19 (n = 50), mild COVID-19 (n = 35), and mild non–COVID-19 (n = 30) patients. Spearman’s rank order correlation values (r) are shown from red (–1.0) to blue (1.0); r values are indicated by color and square size. P values are indicated by black asterisks (*<0.05; **<0.01; ***<0.001). (B) Correlation of MUC1 mRNA expression with age. Statistics (r and P values) for the full data set (n = 135), critically ill COVID-19 patient data (n = 50), mild COVID-19 patient data (n = 35), and mild non–COVID-19 patient data (n = 30) are shown in black, blue, orange, and green, respectively. (C) Correlation of MUC20 mRNA expression with age. Statistics (r and P values) for the full data set (n = 135), critically ill COVID-19 patient data (n = 50), mild COVID-19 patient data (n = 35), and mild non–COVID-19 patient data (n = 30) are shown in black, blue, orange, and green, respectively. (D) Correlation of MUC1 mRNA expression with MUC2 mRNA expression. Statistics (r and P values) for the full data set (n = 135), critically ill COVID-19 patient data (n = 50), mild COVID-19 patient data (n = 35), and mild non–COVID-19 patient data (n = 30) are shown in black, blue, orange, and green, respectively. (E) Correlation of MUC16 mRNA expression with MUC20 mRNA expression. Statistics (r and P values) for the full data set (n = 135), critically ill COVID-19 patient data (n = 50), mild COVID-19 patient data (n = 35), and mild non–COVID-19 patient data (n = 30) are shown in black, blue, orange, and green, respectively.

