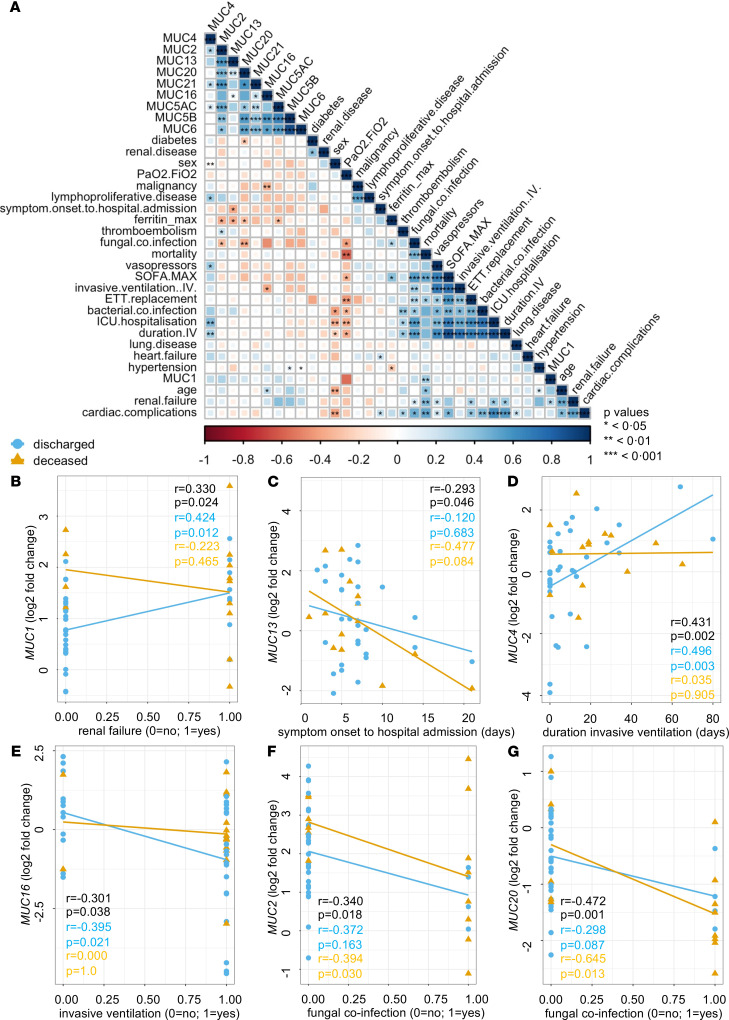
Figure 7. Associations of peripheral mucin mRNA expression with the clinical data of critically ill COVID-19 patients.
(A) Correlogram of critically ill COVID-19 (n = 50) patients. Spearman’s rank order correlation values (r) are shown from red (–1.0) to blue (1.0); r values are indicated by color and square size. P values are indicated by black asterisks (*<0.05; **<0.01; ***<0.001). (B) Correlation of MUC1 mRNA expression with renal failure. Statistics (r and P values) for the full data set (n = 50), discharged patient data (n = 36), and deceased patient data (n = 14) are shown in black, blue, and orange, respectively. (C) Correlation of MUC13 mRNA expression with symptom onset to hospital admission. Statistics (r and P values) for the full data set (n = 50), discharged patient data (n = 36), and deceased patient data (n = 14) are shown in black, blue, and orange, respectively. (D) Correlation of MUC4 mRNA expression with duration of invasive ventilation. Statistics (r and P values) for the full data set (n = 50), discharged patient data (n = 36), and deceased patient data (n = 14) are shown in black, blue, and orange, respectively. (E) Correlation of MUC16 mRNA expression with the need for invasive ventilation. Statistics (r and P values) for the full data set (n = 50), discharged patient data (n = 36), and deceased patient data (n = 14) are shown in black, blue, and orange, respectively. (F) Correlation of MUC2 mRNA expression with fungal coinfection. Statistics (r and P values) for the full data set (n = 50), discharged patient data (n = 36), and deceased patient data (n = 14) are shown in black, blue, and orange, respectively. (G) Correlation of MUC20 mRNA expression with fungal coinfection. Statistics (r and P values) for the full data set (n = 50), discharged patient data (n = 36), and deceased patient data (n = 14) are shown in black, blue, and orange, respectively.

