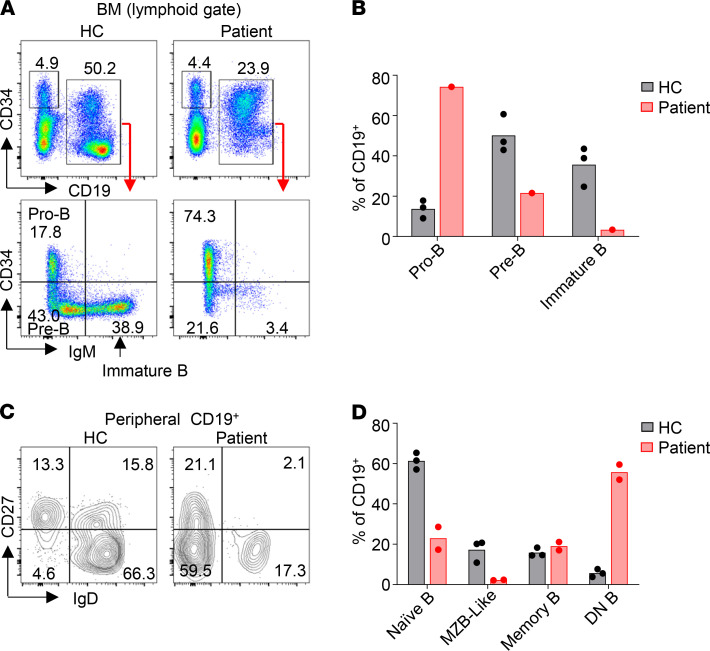
Figure 3. Impaired B cell development and maturation in the patient.
(A and B) Impaired B cell development in the patient. (A) FACS analysis of pro-B (CD19+CD34+IgM–), pre-B (CD19+CD34–IgM–), and immature B (CD19+CD34–IgM+) cells in the BM of the patient and HC. (B) Mean of the results in A obtained with the patient and 3 HCs. (C and D) Enhanced B cell differentiation. (C) FACS profiles showing the peripheral blood naive B (IgD+CD27–), MZB-like (IgD+CD27+), memory B (IgD–CD27+) and DN B (IgD–CD27–) population. (D) Mean of the results in C obtained with the patient (2 independent experiments) and 3 HCs is shown.

