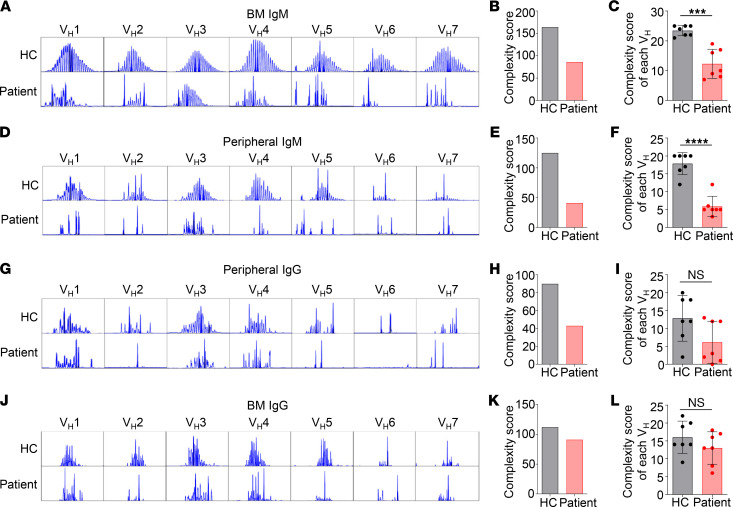
Figure 4. Reduced IgH diversity in the patient BM IgM and peripheral blood IgM and IgG relative to HC.
IgH CDR3 profiles for each of the 7 VH families in BM IgM (A), peripheral IgM (D), peripheral IgG (G), and BM IgG (J). The x axis indicates CDR3 length, and the y axis displays fluorescence intensity. (B, E, H, and K) IgH repertoire diversity expressed as the sum of the number of different CDR3 lengths. (C, F, I, and L) Average number of CDR3 lengths for each of the VH genes (mean ± SD). Statistical analyses were performed using Student’s t test. ***P < 0.001; ****P < 0.0001.

