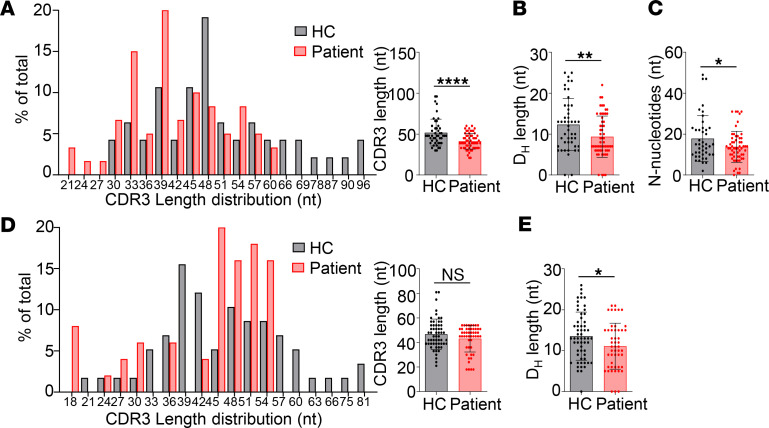
Figure 6. Decreased CDR3 lengths in the patient.
(A–C) IgH-CDR3 profiles of the BM IgM isotype. (A) CDR3 length distribution and average CDR3 length (mean ± SD) of an HC and the patient. (B) Average length of the DH segments. Mean ± SD is shown. (C) Reduced N nucleotide addition in the patient (mean ± SD). (D and E) IgH-CDR3 profiles of peripheral IgM isotype. (D) CDR3 length distribution and average CDR3 length (mean ± SD). (E) Average length of the DH segments. Mean ± SD is shown. Statistical analyses were performed using Student’s t test. *P < 0.05; **P < 0.01; ****P < 0.0001.

