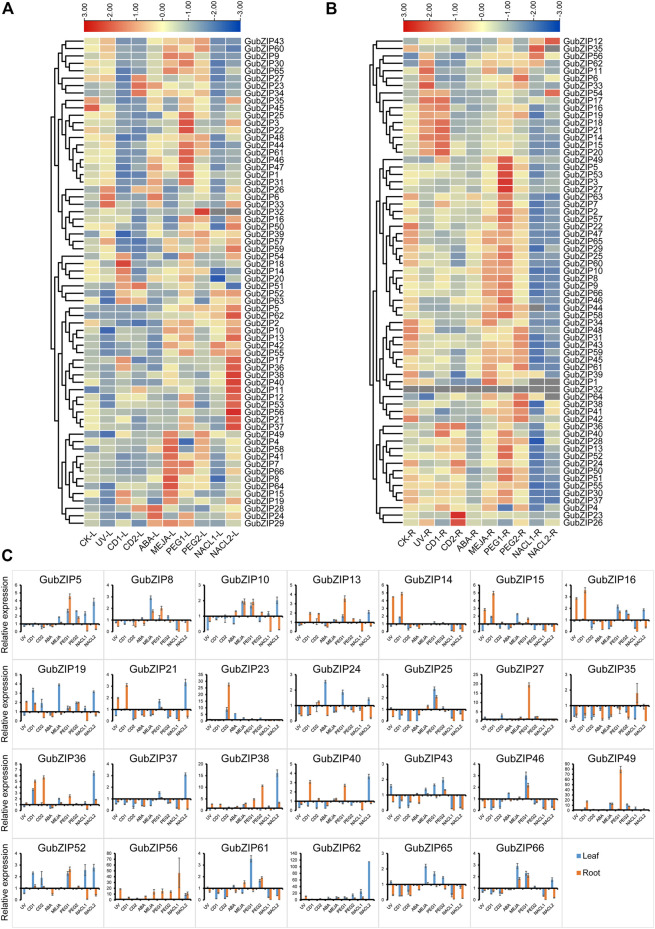
FIGURE 7.
Expression pattern of bZIP genes in Glycyrrhiza uralensis under abiotic stress. (A) Heat maps of the relative expression of bZIP genes in leaf tissue of G. uralensis under abiotic stress. (B) Heat maps of the relative expression of bZIP genes in root tissue of G. uralensis under abiotic stress. The level of expression is indicated by the graded color code. (C) The qRT-PCR expression profile of GubZIP genes under abiotic stress. The expression level of GubZIPs in the control group was standardized as “1.” The vertical bar represents the standard error of the average. Significance is indicated on the bar graph by a–i for the difference between gene expression; significance was confirmed by least significant difference (LSD) test (p < 0.05).

