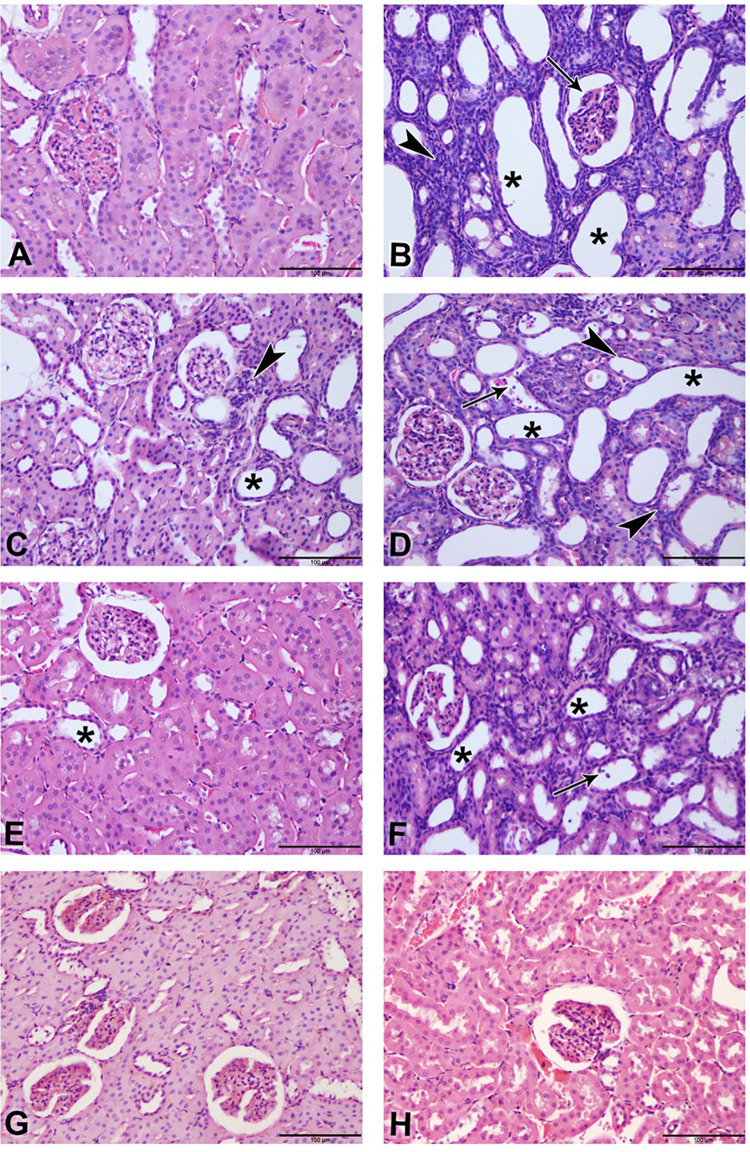
Fig 3.
Photomicrograph of renal tissues (Bar = 100μm, H&E stain): (A; control group) showing normal renal tissue with intact glomeruli and renal tubules (Score 0); (B; adenine group) showing marked renal tubular necrosis with pyknotic nuclei (arrowheads), cystic dilatation of multiple renal tubules (asterisks), marked basophilia, and dilatation of bowman’s capsule (arrow) (Score 4); (C; streptozotocin group) showing moderate basophilia with cystic dilation of few renal tubules (asterisk) and focal aggregates of mononuclear cells (arrowhead) (Score 2); (D; adenine + streptozotocin group) showing marked basophilia, renal tubular necrosis (arrowheads), cystic dilatation of multiple renal tubules (asterisks), and cellular casts in multiple tubules (arrow) (Score 4); (E; flaxseed group) showing histologically normal renal tubules with the exception of few dilated tubules (asterisk) (Score 1); (F; adenine + flaxseed group) showing tubular basophilia, tubular dilatations (asterisks) and cellular casts (arrow) (Score 3); (G; streptozotocin + flaxseed group) showing normal histological structures of the majority of the renal tubules with intact glomeruli (Score 1); (H; adenine + streptozotocin + flaxseed group) showing normal histological structures of the renal tubules with intact glomeruli (Score 0).

