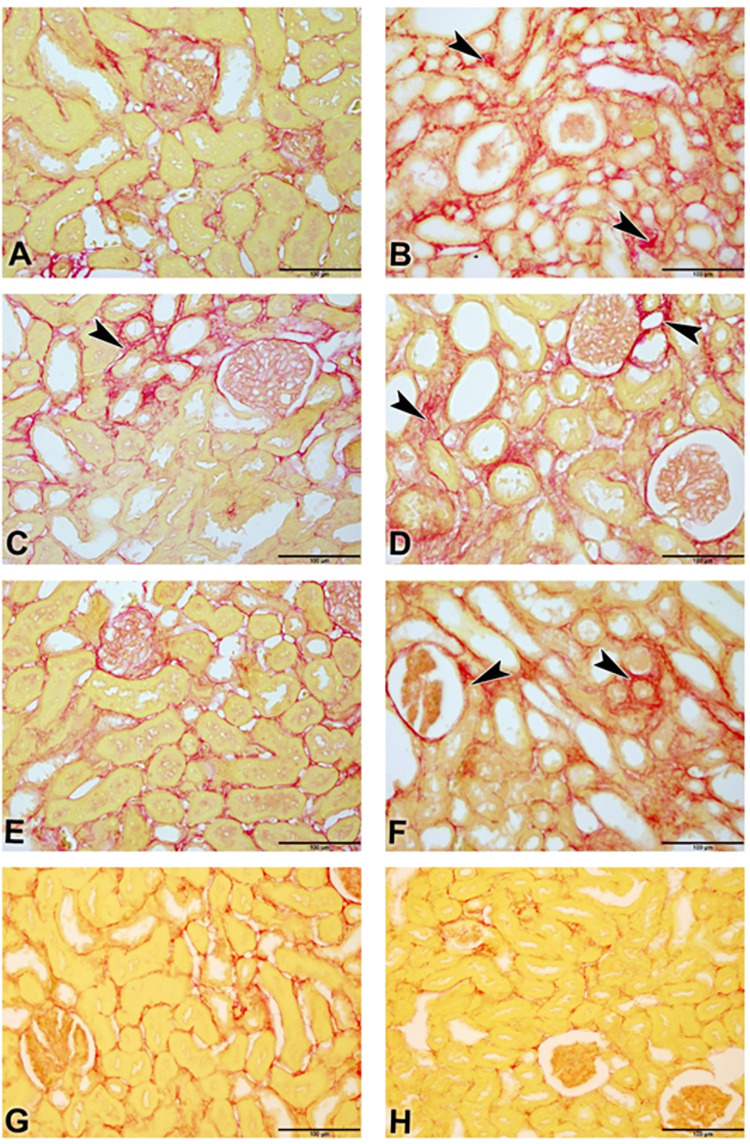
Fig 4.
Photomicrograph of renal tissues (Bar = 100μm, A-G; Picro-Sirius red); renal tissues of groups A-H (A: control, B: adenine, C: streptozotocin, D: adenine + streptozotocin, E: flaxseed, F: adenine + flaxseed, G: streptozotocin + flaxseed, H: adenine + streptozotocin + flaxseed) showing the distribution of Sirius Red-stained fibrotic areas fibers (arrowheads) and yellow non-collagen structures.

