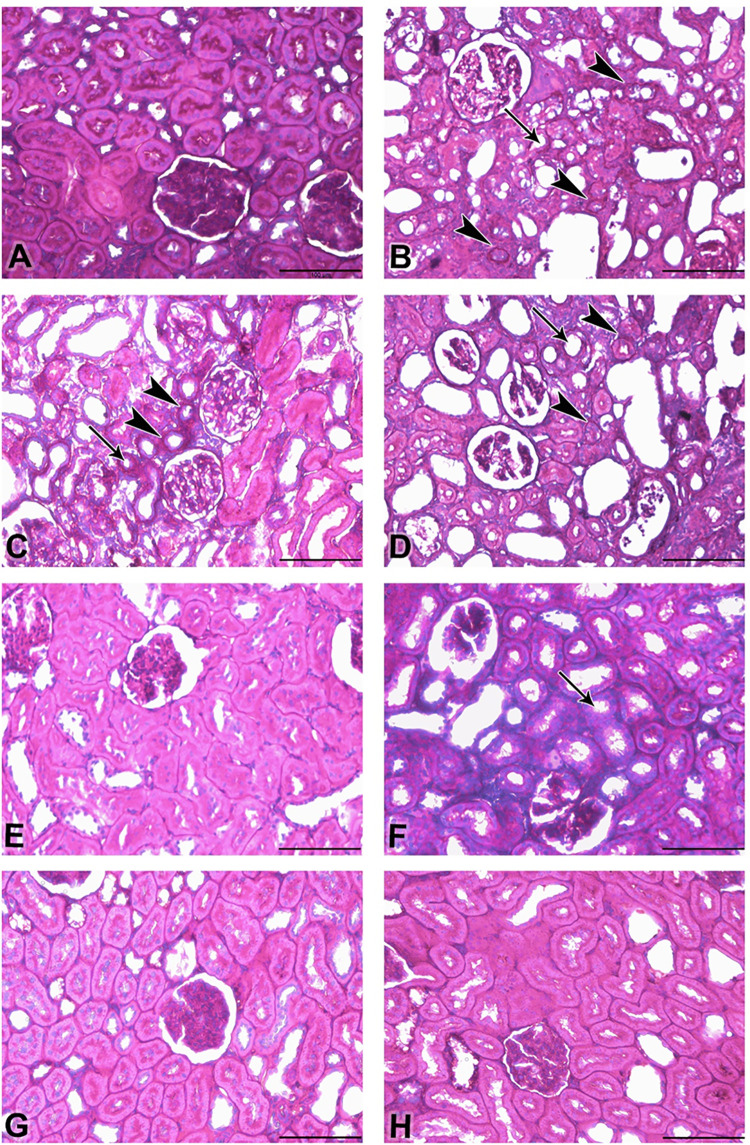
Fig 5.
Photomicrograph of renal tissues (Bar = 100μm, A-G; Periodic Acid Schiff (PAS)); renal tissues of groups A-H (A: control, B: adenine, C: streptozotocin, D: adenine + streptozotocin, E: flaxseed, F: adenine + flaxseed, G: streptozotocin + flaxseed, H: adenine + streptozotocin + flaxseed), showing tubular atrophy represented by a thickened tubular basement membrane (arrowheads) stained positive (magenta red) for PAS and loss of tubular brush borders (arrows).

