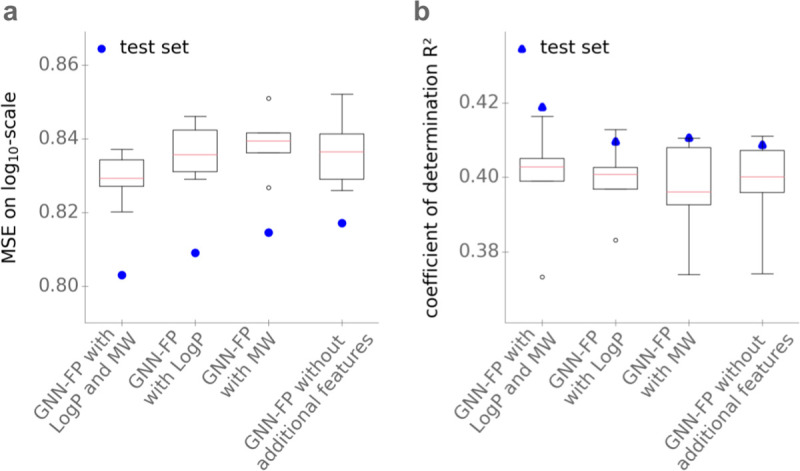
Fig 3. Adding MW and LogP as features has only a minor effect on the performance of the GNN in predicting KM.

(a) MSE on log10-scale. (b) Coefficients of determination R2. Models use the GNN with additional features LogP and MW; with only one of the additional features; and without the 2 features. Boxplots summarize the results of the 5-fold cross-validations on the training set; blue dots show the results on the test set. The data underlying the graphs shown in this figure can be found at https://github.com/AlexanderKroll/KM_prediction/tree/master/figures_data. GNN, graph neural network; LogP, octanol–water partition coefficient; MSE, mean squared error; MW, molecular weight.
