Figure 7.

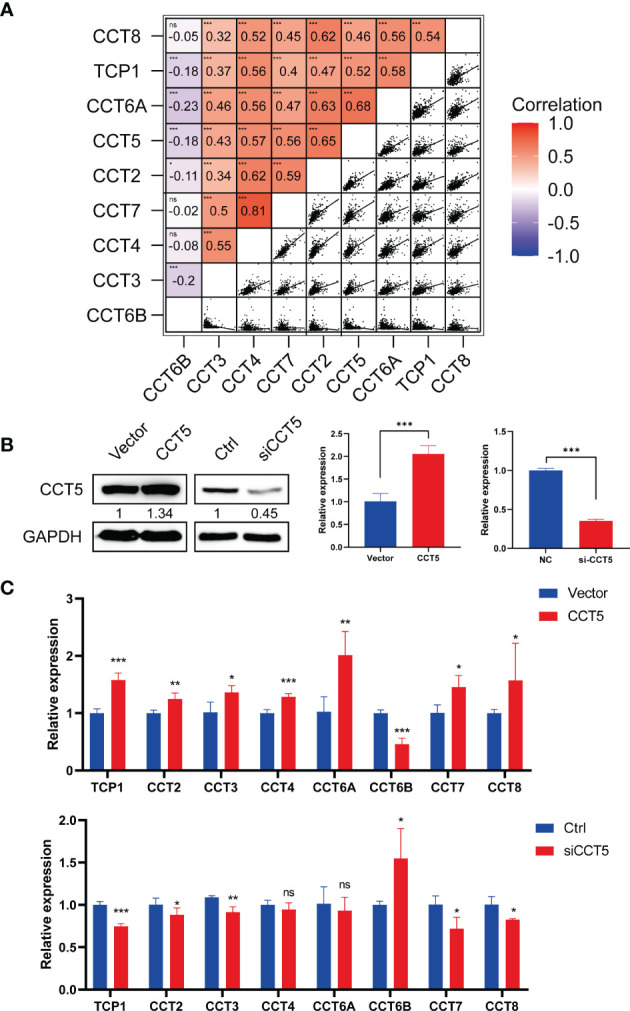
Significant correlation between expression levels of TRiC subunits in HCC. (A) Pearson correlation analysis of the TRiC subunits in HCC (from cBioPortal). (B) Efficiencies of CCT overexpression and knockdown in SK-HEP1 cells following plasmid and siRNA transfection, respectively, as confirmed by western blotting (left) and qPCR (right). (C) CCT5 overexpression and knockdown-induced changes in the expression of other subunits were confirmed by qPCR. *p < 0.05, **p < 0.01, ***p < 0.001. ns, no significance.
